

has shown a positive change of 53.65%, while Tapukara station has shown a
negative change of 45.38%. The rest of the stations have shown an almost constant
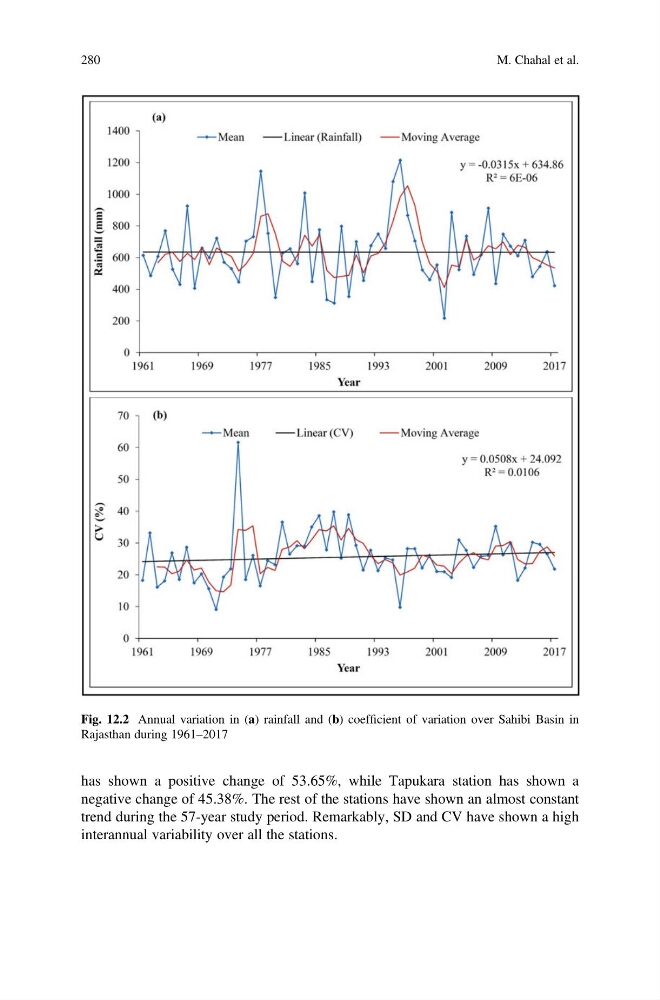
trend during the 57-year study period. Remarkably, SD and CV have shown a high
interannual variability over all the stations.
Fig. 12.2 Annual variation in (a) rainfall and (b) coefficient of variation over Sahibi Basin in
Rajasthan during 1961–2017
280
M. Chahal et al.
negative change of 45.38%. The rest of the stations have shown an almost constant
trend during the 57-year study period. Remarkably, SD and CV have shown a high
interannual variability over all the stations.
Fig. 12.2 Annual variation in (a) rainfall and (b) coefficient of variation over Sahibi Basin in
Rajasthan during 1961–2017
280
M. Chahal et al.