

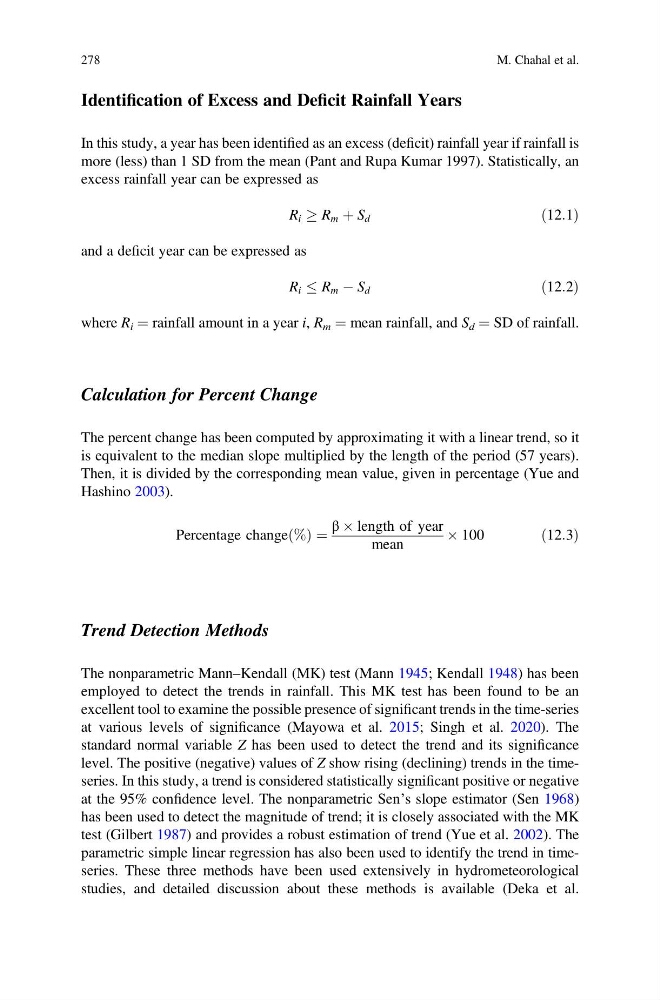
Identification of Excess and Deficit Rainfall Years
In this study, a year has been identified as an excess (deficit) rainfall year if rainfall is
more (less) than 1 SD from the mean (Pant and Rupa Kumar 1997). Statistically, an
excess rainfall year can be expressed as
R i ! R m þ S d
ð12:1Þ
and a deficit year can be expressed as
R i R m À S d
ð12:2Þ
where R i ¼ rainfall amount in a year i, R m ¼ mean rainfall, and S d ¼ SD of rainfall.
Calculation for Percent Change
The percent change has been computed by approximating it with a linear trend, so it
is equivalent to the median slope multiplied by the length of the period (57 years).
Then, it is divided by the corresponding mean value, given in percentage (Yue and
Hashino 2003).
Percentage change %
ð Þ ¼
β Â length of year
mean
 100
ð12:3Þ
Trend Detection Methods
The nonparametric Mann–Kendall (MK) test (Mann 1945; Kendall 1948) has been
employed to detect the trends in rainfall. This MK test has been found to be an
excellent tool to examine the possible presence of significant trends in the time-series
at various levels of significance (Mayowa et al. 2015; Singh et al. 2020). The
standard normal variable Z has been used to detect the trend and its significance
level. The positive (negative) values of Z show rising (declining) trends in the timeseries. In this study, a trend is considered statistically significant positive or negative
at the 95% confidence level. The nonparametric Sen’s slope estimator (Sen 1968)
has been used to detect the magnitude of trend; it is closely associated with the MK
test (Gilbert 1987) and provides a robust estimation of trend (Yue et al. 2002). The
parametric simple linear regression has also been used to identify the trend in timeseries. These three methods have been used extensively in hydrometeorological
studies, and detailed discussion about these methods is available (Deka et al.
278
M. Chahal et al.
In this study, a year has been identified as an excess (deficit) rainfall year if rainfall is
more (less) than 1 SD from the mean (Pant and Rupa Kumar 1997). Statistically, an
excess rainfall year can be expressed as
R i ! R m þ S d
ð12:1Þ
and a deficit year can be expressed as
R i R m À S d
ð12:2Þ
where R i ¼ rainfall amount in a year i, R m ¼ mean rainfall, and S d ¼ SD of rainfall.
Calculation for Percent Change
The percent change has been computed by approximating it with a linear trend, so it
is equivalent to the median slope multiplied by the length of the period (57 years).
Then, it is divided by the corresponding mean value, given in percentage (Yue and
Hashino 2003).
Percentage change %
ð Þ ¼
β Â length of year
mean
 100
ð12:3Þ
Trend Detection Methods
The nonparametric Mann–Kendall (MK) test (Mann 1945; Kendall 1948) has been
employed to detect the trends in rainfall. This MK test has been found to be an
excellent tool to examine the possible presence of significant trends in the time-series
at various levels of significance (Mayowa et al. 2015; Singh et al. 2020). The
standard normal variable Z has been used to detect the trend and its significance
level. The positive (negative) values of Z show rising (declining) trends in the timeseries. In this study, a trend is considered statistically significant positive or negative
at the 95% confidence level. The nonparametric Sen’s slope estimator (Sen 1968)
has been used to detect the magnitude of trend; it is closely associated with the MK
test (Gilbert 1987) and provides a robust estimation of trend (Yue et al. 2002). The
parametric simple linear regression has also been used to identify the trend in timeseries. These three methods have been used extensively in hydrometeorological
studies, and detailed discussion about these methods is available (Deka et al.
278
M. Chahal et al.