

drawn considering the La Niña years and peak rainfall that shows a positive linear
regression of 0.02 (Fig. 10.7). The positive regression indicates that rainfall
increases as the La Niña intensity increases, and vice versa. Peak rainfall is calibrated
by the month of the year with the highest amount of rainfall. By using the least
squares method, the linear regression (R) is obtained.
ENSO Effect on Deficit Rainfall
Graphs are drawn to correlate deficit rainfall with El Niño and La Niña years
(Figs. 10.8 and 10.9). By using the least squares method, the linear regression (R)
is obtained. Figure 10.8 provides a clear description that increases in intensity as El
Niño events occur with more deficit rainfall, with an R of 0.01. Figure 10.9 shows a
negative regression, but it is negligible when compared to the El Niño regression
value. These graphs show that peak rainfall occurs in El Niño years in comparison
with La Niña years. Deficit rainfall is classified by the month of the year that had the
least amount of rainfall.
ENSO comprises both El Niño and La Niña, which have negative and positive
impacts, respectively, along coastal Karnataka. A negative impact signifies deficit
rainfall, which in turn produces drought conditions along the inner parts of coastal
Karnataka, whereas the positive impact signifies excess rainfall, which in turn produces floods if the dams and reservoirs are not properly maintained. However, El
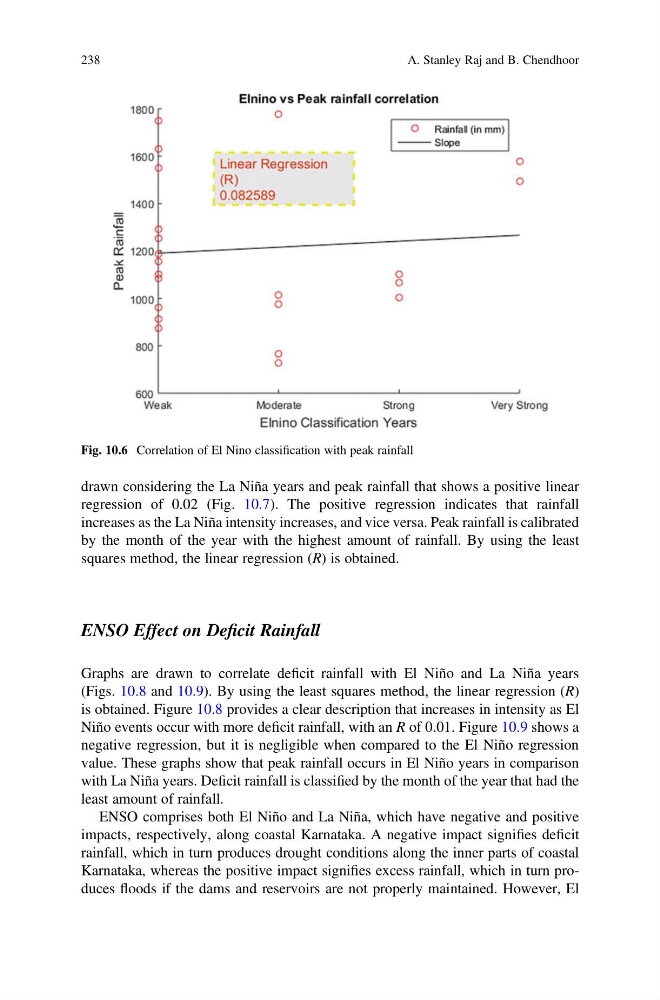
Fig. 10.6 Correlation of El Nino classification with peak rainfall
238
A. Stanley Raj and B. Chendhoor
regression of 0.02 (Fig. 10.7). The positive regression indicates that rainfall
increases as the La Niña intensity increases, and vice versa. Peak rainfall is calibrated
by the month of the year with the highest amount of rainfall. By using the least
squares method, the linear regression (R) is obtained.
ENSO Effect on Deficit Rainfall
Graphs are drawn to correlate deficit rainfall with El Niño and La Niña years
(Figs. 10.8 and 10.9). By using the least squares method, the linear regression (R)
is obtained. Figure 10.8 provides a clear description that increases in intensity as El
Niño events occur with more deficit rainfall, with an R of 0.01. Figure 10.9 shows a
negative regression, but it is negligible when compared to the El Niño regression
value. These graphs show that peak rainfall occurs in El Niño years in comparison
with La Niña years. Deficit rainfall is classified by the month of the year that had the
least amount of rainfall.
ENSO comprises both El Niño and La Niña, which have negative and positive
impacts, respectively, along coastal Karnataka. A negative impact signifies deficit
rainfall, which in turn produces drought conditions along the inner parts of coastal
Karnataka, whereas the positive impact signifies excess rainfall, which in turn produces floods if the dams and reservoirs are not properly maintained. However, El
Fig. 10.6 Correlation of El Nino classification with peak rainfall
238
A. Stanley Raj and B. Chendhoor