

Global Warming and Climate Change
Climate change is most affected in India by the release of GHG during cement
production, thermal power plant operation, combustion of fossil fuels, and other
pyro-treatment activities. Recently, India has begun various initiatives to reduce
carbon in the atmosphere by educating the people, checking the combustion of fossil
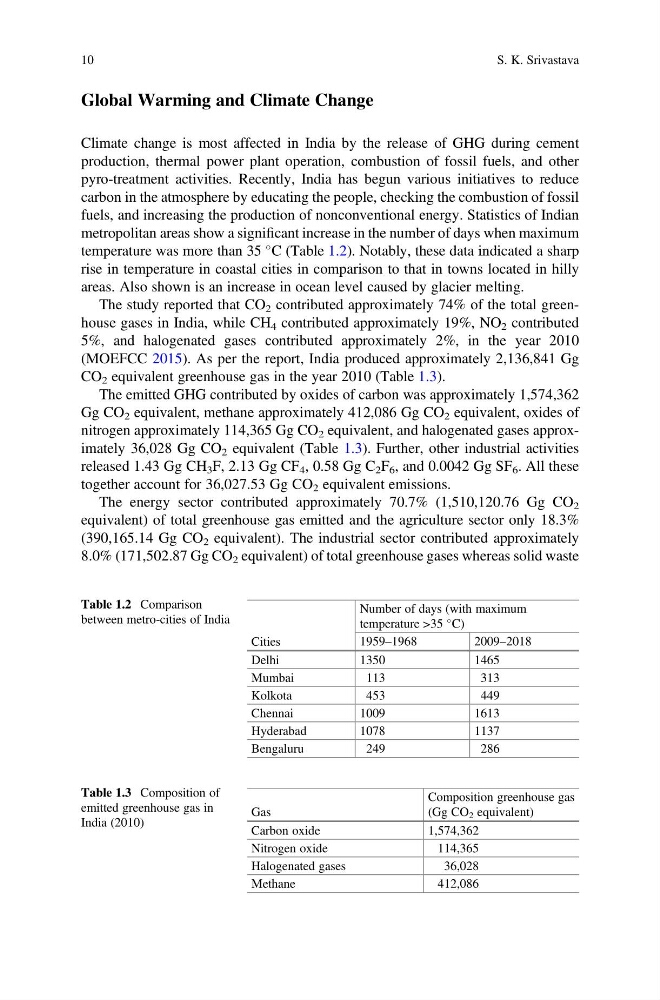
fuels, and increasing the production of nonconventional energy. Statistics of Indian
metropolitan areas show a significant increase in the number of days when maximum
temperature was more than 35
C (Table 1.2). Notably, these data indicated a sharp
rise in temperature in coastal cities in comparison to that in towns located in hilly
areas. Also shown is an increase in ocean level caused by glacier melting.
The study reported that CO 2 contributed approximately 74% of the total greenhouse gases in India, while CH 4 contributed approximately 19%, NO 2 contributed
5%, and halogenated gases contributed approximately 2%, in the year 2010
(MOEFCC 2015). As per the report, India produced approximately 2,136,841 Gg
CO 2 equivalent greenhouse gas in the year 2010 (Table 1.3).
The emitted GHG contributed by oxides of carbon was approximately 1,574,362
Gg CO 2 equivalent, methane approximately 412,086 Gg CO 2 equivalent, oxides of
nitrogen approximately 114,365 Gg CO 2 equivalent, and halogenated gases approximately 36,028 Gg CO 2 equivalent (Table 1.3). Further, other industrial activities
released 1.43 Gg CH 3 F, 2.13 Gg CF 4 , 0.58 Gg C 2 F 6 , and 0.0042 Gg SF 6 . All these
together account for 36,027.53 Gg CO 2 equivalent emissions.
The energy sector contributed approximately 70.7% (1,510,120.76 Gg CO 2
equivalent) of total greenhouse gas emitted and the agriculture sector only 18.3%
(390,165.14 Gg CO 2 equivalent). The industrial sector contributed approximately
8.0% (171,502.87 Gg CO 2 equivalent) of total greenhouse gases whereas solid waste
Table 1.2 Comparison
between metro-cities of India
Cities
Number of days (with maximum
temperature >35
C)
1959–1968
2009–2018
Delhi
1350
1465
Mumbai
113
313
Kolkota
453
449
Chennai
1009
1613
Hyderabad
1078
1137
Bengaluru
249
286
Table 1.3 Composition of
emitted greenhouse gas in
India (2010)
Gas
Composition greenhouse gas
(Gg CO 2 equivalent)
Carbon oxide
1,574,362
Nitrogen oxide
114,365
Halogenated gases
36,028
Methane
412,086
10
S. K. Srivastava
Climate change is most affected in India by the release of GHG during cement
production, thermal power plant operation, combustion of fossil fuels, and other
pyro-treatment activities. Recently, India has begun various initiatives to reduce
carbon in the atmosphere by educating the people, checking the combustion of fossil
fuels, and increasing the production of nonconventional energy. Statistics of Indian
metropolitan areas show a significant increase in the number of days when maximum
temperature was more than 35
C (Table 1.2). Notably, these data indicated a sharp
rise in temperature in coastal cities in comparison to that in towns located in hilly
areas. Also shown is an increase in ocean level caused by glacier melting.
The study reported that CO 2 contributed approximately 74% of the total greenhouse gases in India, while CH 4 contributed approximately 19%, NO 2 contributed
5%, and halogenated gases contributed approximately 2%, in the year 2010
(MOEFCC 2015). As per the report, India produced approximately 2,136,841 Gg
CO 2 equivalent greenhouse gas in the year 2010 (Table 1.3).
The emitted GHG contributed by oxides of carbon was approximately 1,574,362
Gg CO 2 equivalent, methane approximately 412,086 Gg CO 2 equivalent, oxides of
nitrogen approximately 114,365 Gg CO 2 equivalent, and halogenated gases approximately 36,028 Gg CO 2 equivalent (Table 1.3). Further, other industrial activities
released 1.43 Gg CH 3 F, 2.13 Gg CF 4 , 0.58 Gg C 2 F 6 , and 0.0042 Gg SF 6 . All these
together account for 36,027.53 Gg CO 2 equivalent emissions.
The energy sector contributed approximately 70.7% (1,510,120.76 Gg CO 2
equivalent) of total greenhouse gas emitted and the agriculture sector only 18.3%
(390,165.14 Gg CO 2 equivalent). The industrial sector contributed approximately
8.0% (171,502.87 Gg CO 2 equivalent) of total greenhouse gases whereas solid waste
Table 1.2 Comparison
between metro-cities of India
Cities
Number of days (with maximum
temperature >35
C)
1959–1968
2009–2018
Delhi
1350
1465
Mumbai
113
313
Kolkota
453
449
Chennai
1009
1613
Hyderabad
1078
1137
Bengaluru
249
286
Table 1.3 Composition of
emitted greenhouse gas in
India (2010)
Gas
Composition greenhouse gas
(Gg CO 2 equivalent)
Carbon oxide
1,574,362
Nitrogen oxide
114,365
Halogenated gases
36,028
Methane
412,086
10
S. K. Srivastava