

Comparison of ITA with Z Statistics and Sen’s Slope
Figure 7.8 shows the comparison of trends between the ITA and the Z statistic, and
the magnitudes of the ITA (B slope) and the Sen’s slope of annual and seasonal
rainfall. It is very important to test the reliability of the newly introduced method
Table 7.5 (continued)
ITD innovative trend detection
*
The trend is significance at 10% significance or 90% confidence level
**
The trend is significance at 5% significance or 95% confidence level
***
The trend is significance at 1% significance or 99% confidence level
The trend was detected by modified Mann-Kendall test based on lag 1 autocorrelation
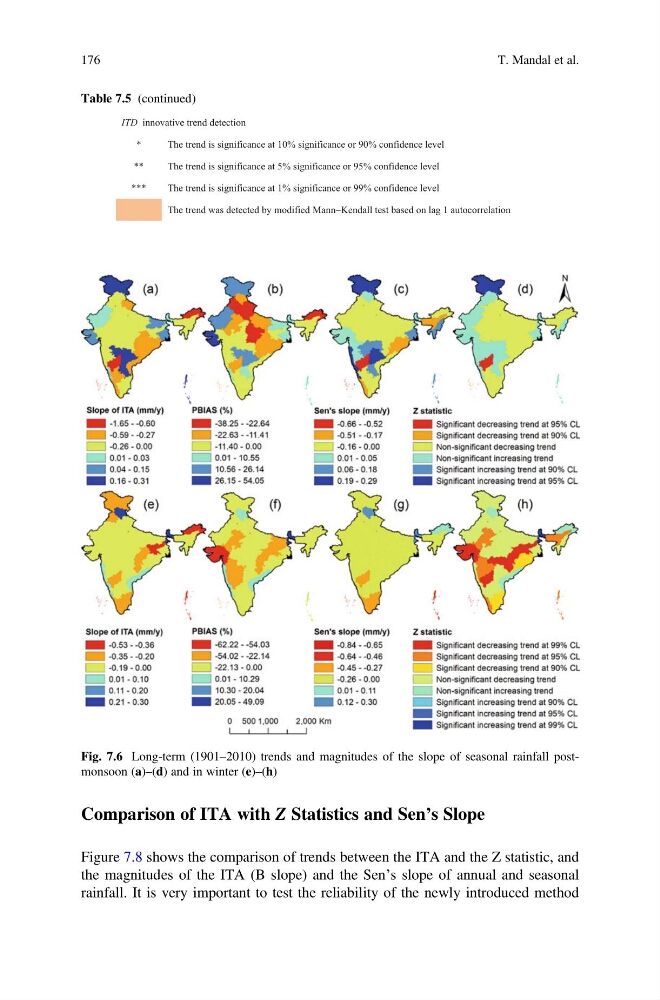
Fig. 7.6 Long-term (1901–2010) trends and magnitudes of the slope of seasonal rainfall postmonsoon (a)–(d) and in winter (e)–(h)
176
T. Mandal et al.
Figure 7.8 shows the comparison of trends between the ITA and the Z statistic, and
the magnitudes of the ITA (B slope) and the Sen’s slope of annual and seasonal
rainfall. It is very important to test the reliability of the newly introduced method
Table 7.5 (continued)
ITD innovative trend detection
*
The trend is significance at 10% significance or 90% confidence level
**
The trend is significance at 5% significance or 95% confidence level
***
The trend is significance at 1% significance or 99% confidence level
The trend was detected by modified Mann-Kendall test based on lag 1 autocorrelation
Fig. 7.6 Long-term (1901–2010) trends and magnitudes of the slope of seasonal rainfall postmonsoon (a)–(d) and in winter (e)–(h)
176
T. Mandal et al.