

the skewness coefficient (Pearson’s) is not smaller than zero and the majority are
positively skewed; also, the mean, median, and mode of the datasets are different
from each other. On the other hand Kurtosis of the time series dataset varied from
À0.56 (in south interior Karnataka) to 10.12 (in Arunachal Pradesh). As the values
are lesser and greater than zero, the kurtosis is not mesokurtic (normal distribution);
rather, the kurtosis specifies platykurtic (thin tails) and leptokurtic (fat tails) i.e. non
normal distribution.
Trends in Rainfall Pattern
In this study, a comparative assessment has been carried out between the advanced
graphical method of trend detection, that is, the innovative trend analysis (ITA) and a
traditional nonparametric statistical approach (MK and mMK tests), for investigation
of long-term (1901–2015) trends in the annual and seasonal rainfall of India. As
space is inadequate, only the ITA graph of some selected meteorological subdivisions from the annual and seasons scale is shown in this paper. The ITA graphs are
presented in Fig. 7.4 (annual) and Fig. 7.7 (monsoon). The figures also show the
significance of trends at the 0.05 level. If the data points are inside the significance
band (along the 1:1 line), it considered as no trend in the data series. It is regarded as
a significant trend if the data points are below or above the influential band.
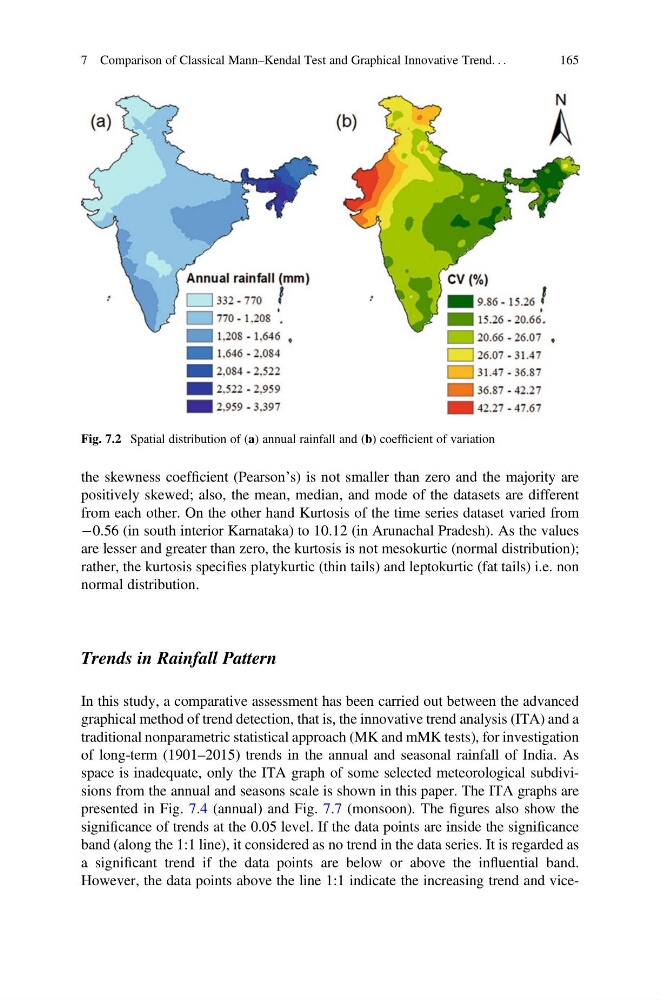
However, the data points above the line 1:1 indicate the increasing trend and viceFig. 7.2 Spatial distribution of (a) annual rainfall and (b) coefficient of variation
7 Comparison of Classical Mann–Kendal Test and Graphical Innovative Trend. . .
165
positively skewed; also, the mean, median, and mode of the datasets are different
from each other. On the other hand Kurtosis of the time series dataset varied from
À0.56 (in south interior Karnataka) to 10.12 (in Arunachal Pradesh). As the values
are lesser and greater than zero, the kurtosis is not mesokurtic (normal distribution);
rather, the kurtosis specifies platykurtic (thin tails) and leptokurtic (fat tails) i.e. non
normal distribution.
Trends in Rainfall Pattern
In this study, a comparative assessment has been carried out between the advanced
graphical method of trend detection, that is, the innovative trend analysis (ITA) and a
traditional nonparametric statistical approach (MK and mMK tests), for investigation
of long-term (1901–2015) trends in the annual and seasonal rainfall of India. As
space is inadequate, only the ITA graph of some selected meteorological subdivisions from the annual and seasons scale is shown in this paper. The ITA graphs are
presented in Fig. 7.4 (annual) and Fig. 7.7 (monsoon). The figures also show the
significance of trends at the 0.05 level. If the data points are inside the significance
band (along the 1:1 line), it considered as no trend in the data series. It is regarded as
a significant trend if the data points are below or above the influential band.
However, the data points above the line 1:1 indicate the increasing trend and viceFig. 7.2 Spatial distribution of (a) annual rainfall and (b) coefficient of variation
7 Comparison of Classical Mann–Kendal Test and Graphical Innovative Trend. . .
165