

Observed Changes in Groundwater Regimes in India
Analysis of spatial and temporal variability of groundwater level helps to understand
the complex mechanism of the groundwater regime and its dynamic relationships
with different natural and anthropogenic attributes (Chen and Feng 2013; Machiwal
and Singh 2015). Natural factors that affect the groundwater regime include climatic
parameters such as rainfall and evapotranspiration, and anthropogenic factors
include pumping from the aquifer, recharge from irrigation systems, and other
practices such as waste disposal (CGWB 2019a, b).
In pre monsoon, monsoon, post monsoon, and winter seasons of 2018–2019, the
general depth of the groundwater level of the country ranged between 5 and
20 meters below ground level (MBGL), 0 and 5 MBGL, 2 and 10 MBGL, and
2 and 10 MBGL, respectively. The spatial pattern of groundwater level in four
seasons indicates the shallow water level (>10 MBGL) in the Ganga–Brahmaputra
alluvial belt and coastal plain areas of the country whereas deep aquifers
(>10 MBGL) are observed in northwestern, western, and a few pockets of peninsular
India. Groundwater level of more than 40 MBGL was noticed in some parts of
Rajasthan, Delhi, and Tamil Nadu (CGWB 2019b).
Comparison of depth of groundwater level of pre monsoon, monsoon, post
monsoon, and winter season of 2018–2019, with decadal mean water level
(2008–2017) of these seasons indicates that more than 50% of the wells of the
country have experienced decline in groundwater level, mostly in the range of
0–2 m. In a few pocket areas of northwestern, southeastern, northern, and central
India, more than 4 m fall in groundwater level in comparison to decadal mean values
is observed in most seasons (Fig. 6.5) (CGWB 2019b).
Temporal fluctuation in groundwater level has been calculated on the basis of
CGWB and different State Agency monitored 12,144 numbers of well data across
the country, applying the parametric statistical technique linear regression analysis to
0
5000000
10000000
15000000
20000000
25000000
1986-87
1993-94
2000-01
2006-07
2013-14
No. of Schemes
Year
Groundwater Irrigation Schemes (1986-2014)
Deep Tubewells
Shallow Tubewells
Dug wells
Total GW Abstruction Schemes
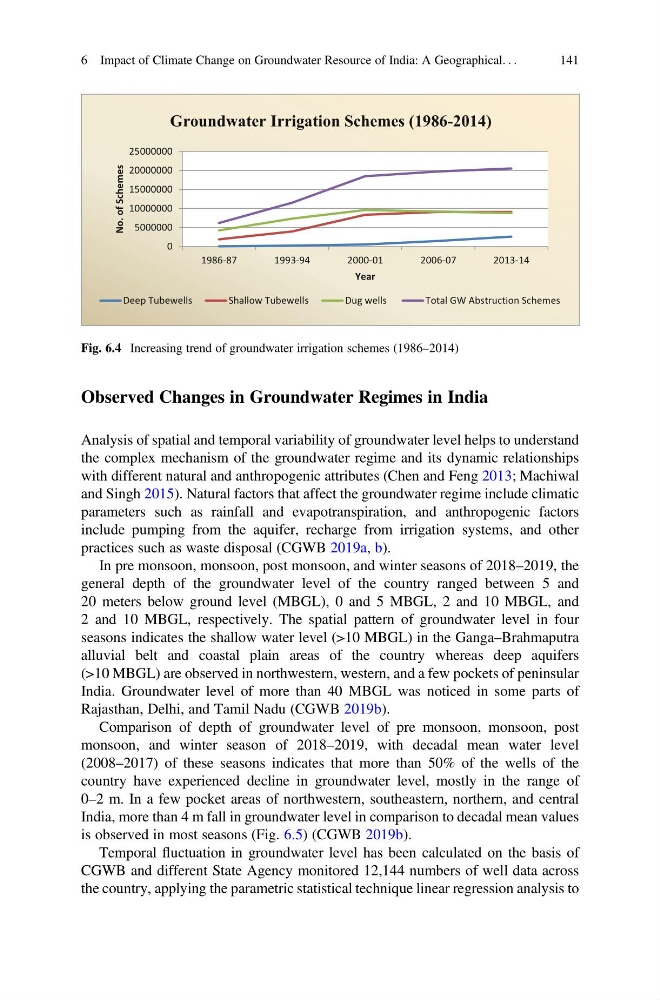
Fig. 6.4 Increasing trend of groundwater irrigation schemes (1986–2014)
6 Impact of Climate Change on Groundwater Resource of India: A Geographical. . .
141
Analysis of spatial and temporal variability of groundwater level helps to understand
the complex mechanism of the groundwater regime and its dynamic relationships
with different natural and anthropogenic attributes (Chen and Feng 2013; Machiwal
and Singh 2015). Natural factors that affect the groundwater regime include climatic
parameters such as rainfall and evapotranspiration, and anthropogenic factors
include pumping from the aquifer, recharge from irrigation systems, and other
practices such as waste disposal (CGWB 2019a, b).
In pre monsoon, monsoon, post monsoon, and winter seasons of 2018–2019, the
general depth of the groundwater level of the country ranged between 5 and
20 meters below ground level (MBGL), 0 and 5 MBGL, 2 and 10 MBGL, and
2 and 10 MBGL, respectively. The spatial pattern of groundwater level in four
seasons indicates the shallow water level (>10 MBGL) in the Ganga–Brahmaputra
alluvial belt and coastal plain areas of the country whereas deep aquifers
(>10 MBGL) are observed in northwestern, western, and a few pockets of peninsular
India. Groundwater level of more than 40 MBGL was noticed in some parts of
Rajasthan, Delhi, and Tamil Nadu (CGWB 2019b).
Comparison of depth of groundwater level of pre monsoon, monsoon, post
monsoon, and winter season of 2018–2019, with decadal mean water level
(2008–2017) of these seasons indicates that more than 50% of the wells of the
country have experienced decline in groundwater level, mostly in the range of
0–2 m. In a few pocket areas of northwestern, southeastern, northern, and central
India, more than 4 m fall in groundwater level in comparison to decadal mean values
is observed in most seasons (Fig. 6.5) (CGWB 2019b).
Temporal fluctuation in groundwater level has been calculated on the basis of
CGWB and different State Agency monitored 12,144 numbers of well data across
the country, applying the parametric statistical technique linear regression analysis to
0
5000000
10000000
15000000
20000000
25000000
1986-87
1993-94
2000-01
2006-07
2013-14
No. of Schemes
Year
Groundwater Irrigation Schemes (1986-2014)
Deep Tubewells
Shallow Tubewells
Dug wells
Total GW Abstruction Schemes
Fig. 6.4 Increasing trend of groundwater irrigation schemes (1986–2014)
6 Impact of Climate Change on Groundwater Resource of India: A Geographical. . .
141