

of 0.8
C–2.5
C, and at the end of the twenty-first century annual mean surface
temperature will increase in the range of 1.3
C–3.5
C. This report also projects the
increase of hot days and nights in the summer season. This report predicts average
3%, 7%, and 10% increases of annual precipitation by 2035, 2065, and 2100,
respectively. Increase in precipitation will be more prominent in summer season
than winter season, as increased atmospheric moisture content will lead to more
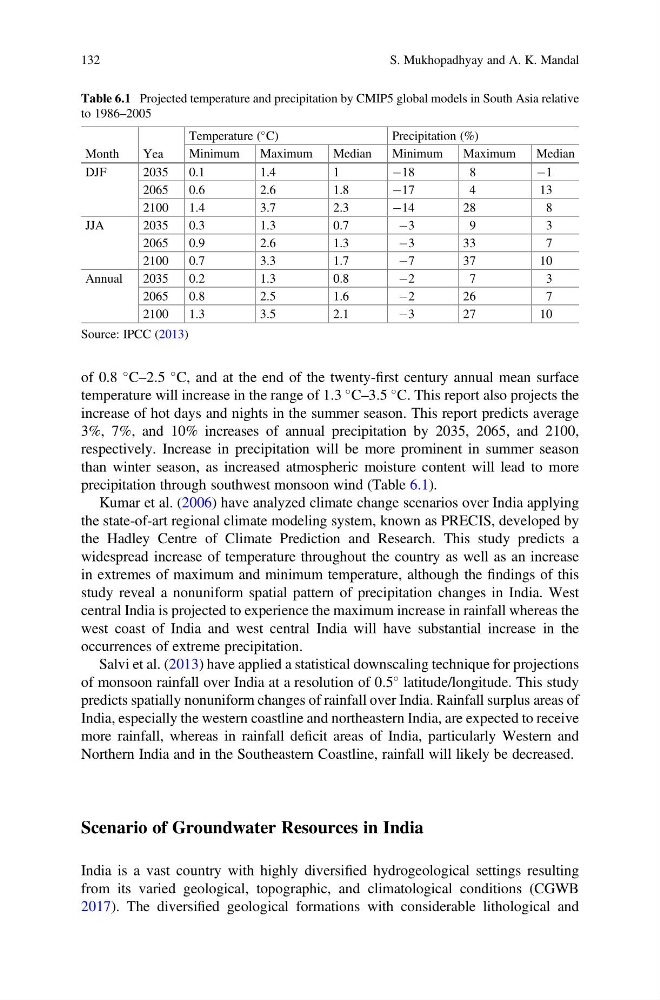
precipitation through southwest monsoon wind (Table 6.1).
Kumar et al. (2006) have analyzed climate change scenarios over India applying
the state-of-art regional climate modeling system, known as PRECIS, developed by
the Hadley Centre of Climate Prediction and Research. This study predicts a
widespread increase of temperature throughout the country as well as an increase
in extremes of maximum and minimum temperature, although the findings of this
study reveal a nonuniform spatial pattern of precipitation changes in India. West
central India is projected to experience the maximum increase in rainfall whereas the
west coast of India and west central India will have substantial increase in the
occurrences of extreme precipitation.
Salvi et al. (2013) have applied a statistical downscaling technique for projections
of monsoon rainfall over India at a resolution of 0.5
latitude/longitude. This study
predicts spatially nonuniform changes of rainfall over India. Rainfall surplus areas of
India, especially the western coastline and northeastern India, are expected to receive
more rainfall, whereas in rainfall deficit areas of India, particularly Western and
Northern India and in the Southeastern Coastline, rainfall will likely be decreased.
Scenario of Groundwater Resources in India
India is a vast country with highly diversified hydrogeological settings resulting
from its varied geological, topographic, and climatological conditions (CGWB
2017). The diversified geological formations with considerable lithological and
Table 6.1 Projected temperature and precipitation by CMIP5 global models in South Asia relative
to 1986–2005
Month
Yea
Temperature (
C)
Precipitation (%)
Minimum
Maximum
Median
Minimum
Maximum
Median
DJF
2035
0.1
1.4
1
À18
8
À1
2065
0.6
2.6
1.8
À17
4
13
2100
1.4
3.7
2.3
À14
28
8
JJA
2035
0.3
1.3
0.7
À3
9
3
2065
0.9
2.6
1.3
À3
3 3
7
2100
0.7
3.3
1.7
À7
3 7
1 0
Annual
2035
0.2
1.3
0.8
À2
7
3
2065
0.8
2.5
1.6
À2
2 6
7
2100
1.3
3.5
2.1
À3
2 7
1 0
Source: IPCC (2013)
132
S. Mukhopadhyay and A. K. Mandal
C–2.5
C, and at the end of the twenty-first century annual mean surface
temperature will increase in the range of 1.3
C–3.5
C. This report also projects the
increase of hot days and nights in the summer season. This report predicts average
3%, 7%, and 10% increases of annual precipitation by 2035, 2065, and 2100,
respectively. Increase in precipitation will be more prominent in summer season
than winter season, as increased atmospheric moisture content will lead to more
precipitation through southwest monsoon wind (Table 6.1).
Kumar et al. (2006) have analyzed climate change scenarios over India applying
the state-of-art regional climate modeling system, known as PRECIS, developed by
the Hadley Centre of Climate Prediction and Research. This study predicts a
widespread increase of temperature throughout the country as well as an increase
in extremes of maximum and minimum temperature, although the findings of this
study reveal a nonuniform spatial pattern of precipitation changes in India. West
central India is projected to experience the maximum increase in rainfall whereas the
west coast of India and west central India will have substantial increase in the
occurrences of extreme precipitation.
Salvi et al. (2013) have applied a statistical downscaling technique for projections
of monsoon rainfall over India at a resolution of 0.5
latitude/longitude. This study
predicts spatially nonuniform changes of rainfall over India. Rainfall surplus areas of
India, especially the western coastline and northeastern India, are expected to receive
more rainfall, whereas in rainfall deficit areas of India, particularly Western and
Northern India and in the Southeastern Coastline, rainfall will likely be decreased.
Scenario of Groundwater Resources in India
India is a vast country with highly diversified hydrogeological settings resulting
from its varied geological, topographic, and climatological conditions (CGWB
2017). The diversified geological formations with considerable lithological and
Table 6.1 Projected temperature and precipitation by CMIP5 global models in South Asia relative
to 1986–2005
Month
Yea
Temperature (
C)
Precipitation (%)
Minimum
Maximum
Median
Minimum
Maximum
Median
DJF
2035
0.1
1.4
1
À18
8
À1
2065
0.6
2.6
1.8
À17
4
13
2100
1.4
3.7
2.3
À14
28
8
JJA
2035
0.3
1.3
0.7
À3
9
3
2065
0.9
2.6
1.3
À3
3 3
7
2100
0.7
3.3
1.7
À7
3 7
1 0
Annual
2035
0.2
1.3
0.8
À2
7
3
2065
0.8
2.5
1.6
À2
2 6
7
2100
1.3
3.5
2.1
À3
2 7
1 0
Source: IPCC (2013)
132
S. Mukhopadhyay and A. K. Mandal