

4.5 Results and Discussion
125
4.5.3 Vibrational Up-Pumping in the Molecular Energetic
Materials
Prior to considering the vibrational up-pumping in the molecular EMs, it is again
necessary to segment the vibrational spectra into sections based on integer values
of max . The definition of max stated in Chap. 3 is somewhat less clearly defined
when considering the molecular materials. A good example of this is NTO. Across
the phonon density of states (DOS, g(ω)) there are clear minima near the top of the
phonon region which, when compared to the phonon dispersion curves in Sect. 4.5.2,
do correlate to regions of gaps, albeit small, in phonon density. The non-zero values of
g(ω) result from the applied Gaussian broadening on generation of the DOS. Previous
works have suggested that in such cases, the top of the phonon bath should be taken to
include (nearly) amalgamated NO 2 rocking modes [19, 20, 23], and therefore act as
the upper limit of the phonon region. For NO 2 containing compounds, these modes
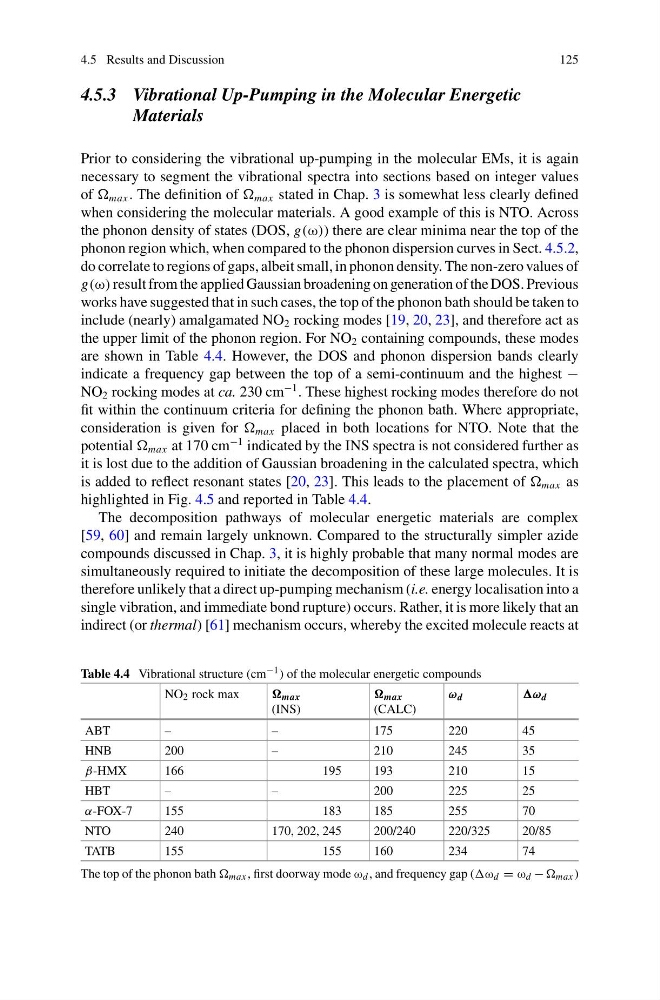
are shown in Table 4.4. However, the DOS and phonon dispersion bands clearly
indicate a frequency gap between the top of a semi-continuum and the highest −
NO 2 rocking modes at ca. 230 cm
−1 . These highest rocking modes therefore do not
fit within the continuum criteria for defining the phonon bath. Where appropriate,
consideration is given for max placed in both locations for NTO. Note that the
potential max at 170 cm
−1 indicated by the INS spectra is not considered further as
it is lost due to the addition of Gaussian broadening in the calculated spectra, which
is added to reflect resonant states [20, 23]. This leads to the placement of max as
highlighted in Fig. 4.5 and reported in Table 4.4.
The decomposition pathways of molecular energetic materials are complex
[59, 60] and remain largely unknown. Compared to the structurally simpler azide
compounds discussed in Chap. 3, it is highly probable that many normal modes are
simultaneously required to initiate the decomposition of these large molecules. It is
therefore unlikely that a direct up-pumping mechanism (i.e. energy localisation into a
single vibration, and immediate bond rupture) occurs. Rather, it is more likely that an
indirect (or thermal) [61] mechanism occurs, whereby the excited molecule reacts at
Table 4.4 Vibrational structure (cm −1 ) of the molecular energetic compounds
NO 2 rock max
max
(INS)
max
(CALC)
ω d
ω d
ABT
–
–
175
220
45
HNB
200
–
210
245
35
β-HMX
166
195
193
210
15
HBT
–
–
200
225
25
α-FOX-7
155
183
185
255
70
NTO
240
170, 202, 245
200/240
220/325
20/85
TATB
155
155
160
234
74
The top of the phonon bath max , first doorway mode ω d , and frequency gap (ω d = ω d − max )
125
4.5.3 Vibrational Up-Pumping in the Molecular Energetic
Materials
Prior to considering the vibrational up-pumping in the molecular EMs, it is again
necessary to segment the vibrational spectra into sections based on integer values
of max . The definition of max stated in Chap. 3 is somewhat less clearly defined
when considering the molecular materials. A good example of this is NTO. Across
the phonon density of states (DOS, g(ω)) there are clear minima near the top of the
phonon region which, when compared to the phonon dispersion curves in Sect. 4.5.2,
do correlate to regions of gaps, albeit small, in phonon density. The non-zero values of
g(ω) result from the applied Gaussian broadening on generation of the DOS. Previous
works have suggested that in such cases, the top of the phonon bath should be taken to
include (nearly) amalgamated NO 2 rocking modes [19, 20, 23], and therefore act as
the upper limit of the phonon region. For NO 2 containing compounds, these modes
are shown in Table 4.4. However, the DOS and phonon dispersion bands clearly
indicate a frequency gap between the top of a semi-continuum and the highest −
NO 2 rocking modes at ca. 230 cm
−1 . These highest rocking modes therefore do not
fit within the continuum criteria for defining the phonon bath. Where appropriate,
consideration is given for max placed in both locations for NTO. Note that the
potential max at 170 cm
−1 indicated by the INS spectra is not considered further as
it is lost due to the addition of Gaussian broadening in the calculated spectra, which
is added to reflect resonant states [20, 23]. This leads to the placement of max as
highlighted in Fig. 4.5 and reported in Table 4.4.
The decomposition pathways of molecular energetic materials are complex
[59, 60] and remain largely unknown. Compared to the structurally simpler azide
compounds discussed in Chap. 3, it is highly probable that many normal modes are
simultaneously required to initiate the decomposition of these large molecules. It is
therefore unlikely that a direct up-pumping mechanism (i.e. energy localisation into a
single vibration, and immediate bond rupture) occurs. Rather, it is more likely that an
indirect (or thermal) [61] mechanism occurs, whereby the excited molecule reacts at
Table 4.4 Vibrational structure (cm −1 ) of the molecular energetic compounds
NO 2 rock max
max
(INS)
max
(CALC)
ω d
ω d
ABT
–
–
175
220
45
HNB
200
–
210
245
35
β-HMX
166
195
193
210
15
HBT
–
–
200
225
25
α-FOX-7
155
183
185
255
70
NTO
240
170, 202, 245
200/240
220/325
20/85
TATB
155
155
160
234
74
The top of the phonon bath max , first doorway mode ω d , and frequency gap (ω d = ω d − max )