

4.5 Results and Discussion
123
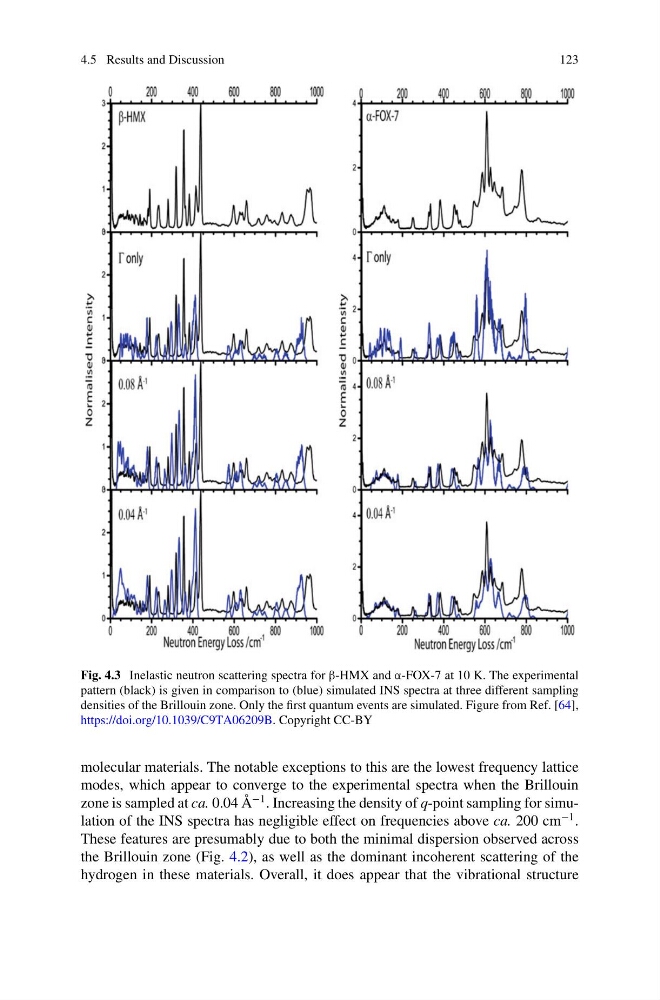
Fig. 4.3 Inelastic neutron scattering spectra for β-HMX and α-FOX-7 at 10 K. The experimental
pattern (black) is given in comparison to (blue) simulated INS spectra at three different sampling
densities of the Brillouin zone. Only the first quantum events are simulated. Figure from Ref. [64],
https://doi.org/10.1039/C9TA06209B. Copyright CC-BY
molecular materials. The notable exceptions to this are the lowest frequency lattice
modes, which appear to converge to the experimental spectra when the Brillouin
zone is sampled at ca. 0.04 Å
−1 . Increasing the density of q-point sampling for simulation of the INS spectra has negligible effect on frequencies above ca. 200 cm
−1 .
These features are presumably due to both the minimal dispersion observed across
the Brillouin zone (Fig. 4.2), as well as the dominant incoherent scattering of the
hydrogen in these materials. Overall, it does appear that the vibrational structure
123
Fig. 4.3 Inelastic neutron scattering spectra for β-HMX and α-FOX-7 at 10 K. The experimental
pattern (black) is given in comparison to (blue) simulated INS spectra at three different sampling
densities of the Brillouin zone. Only the first quantum events are simulated. Figure from Ref. [64],
https://doi.org/10.1039/C9TA06209B. Copyright CC-BY
molecular materials. The notable exceptions to this are the lowest frequency lattice
modes, which appear to converge to the experimental spectra when the Brillouin
zone is sampled at ca. 0.04 Å
−1 . Increasing the density of q-point sampling for simulation of the INS spectra has negligible effect on frequencies above ca. 200 cm
−1 .
These features are presumably due to both the minimal dispersion observed across
the Brillouin zone (Fig. 4.2), as well as the dominant incoherent scattering of the
hydrogen in these materials. Overall, it does appear that the vibrational structure