

120
4 Vibrational Up-Pumping in Some Molecular Energetic Materials
the UV-V is spectra should offer a good indication as to the validity of the calculated
E g values. Furthermore, it should be noted that α-FOX-7 and TATB are both yellow
powders, with the former being more strongly coloured. This indicates an optical
transition in the region of ca. 2.6 eV for both materials.
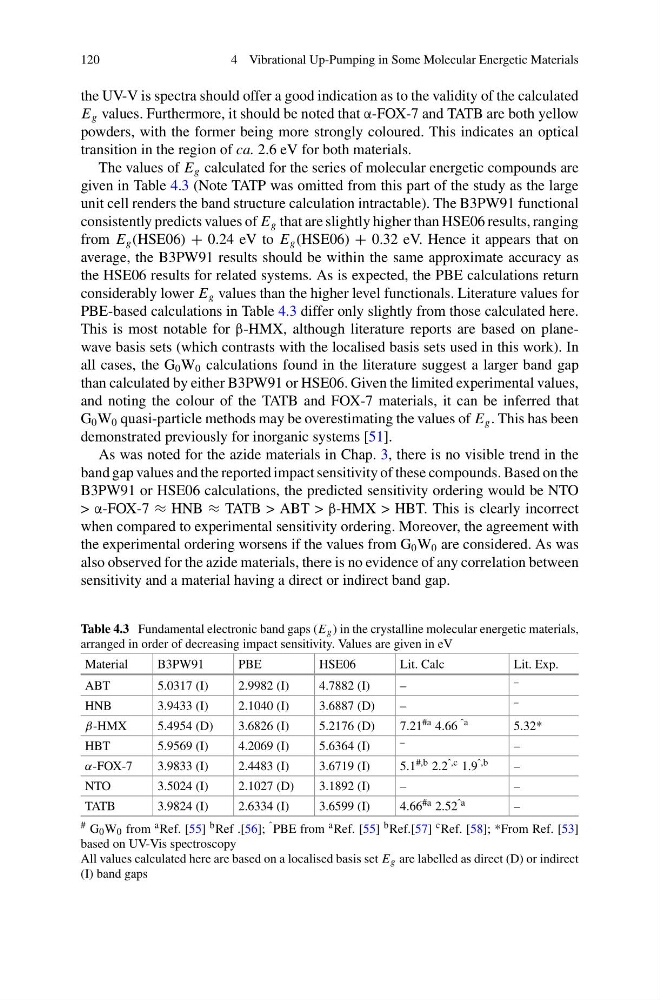
The values of E g calculated for the series of molecular energetic compounds are
given in Table 4.3 (Note TATP was omitted from this part of the study as the large
unit cell renders the band structure calculation intractable). The B3PW91 functional
consistently predicts values of E g that are slightly higher than HSE06 results, ranging
from E g (HSE06) + 0.24 eV to E g (HSE06) + 0.32 eV. Hence it appears that on
average, the B3PW91 results should be within the same approximate accuracy as
the HSE06 results for related systems. As is expected, the PBE calculations return
considerably lower E g values than the higher level functionals. Literature values for
PBE-based calculations in Table 4.3 differ only slightly from those calculated here.
This is most notable for β-HMX, although literature reports are based on planewave basis sets (which contrasts with the localised basis sets used in this work). In
all cases, the G 0 W 0 calculations found in the literature suggest a larger band gap
than calculated by either B3PW91 or HSE06. Given the limited experimental values,
and noting the colour of the TATB and FOX-7 materials, it can be inferred that
G 0 W 0 quasi-particle methods may be overestimating the values of E g . This has been
demonstrated previously for inorganic systems [51].
As was noted for the azide materials in Chap. 3, there is no visible trend in the
band gap values and the reported impact sensitivity of these compounds. Based on the
B3PW91 or HSE06 calculations, the predicted sensitivity ordering would be NTO
> α-FOX-7 ≈ HNB ≈ TATB > ABT > β-HMX > HBT. This is clearly incorrect
when compared to experimental sensitivity ordering. Moreover, the agreement with
the experimental ordering worsens if the values from G 0 W 0 are considered. As was
also observed for the azide materials, there is no evidence of any correlation between
sensitivity and a material having a direct or indirect band gap.
Table 4.3 Fundamental electronic band gaps (E g ) in the crystalline molecular energetic materials,
arranged in order of decreasing impact sensitivity. Values are given in eV
Material
B3PW91
PBE
HSE06
Lit. Calc
Lit. Exp.
ABT
5.0317 (I)
2.9982 (I)
4.7882 (I)
–
–
HNB
3.9433 (I)
2.1040 (I)
3.6887 (D)
–
–
β-HMX
5.4954 (D)
3.6826 (I)
5.2176 (D)
7.21 #a 4.66 ˆa
5.32*
HBT
5.9569 (I)
4.2069 (I)
5.6364 (I)
–
–
α-FOX-7
3.9833 (I)
2.4483 (I)
3.6719 (I)
5.1 #,b 2.2 ˆ,c 1.9 ˆ,b
–
NTO
3.5024 (I)
2.1027 (D)
3.1892 (I)
–
–
TATB
3.9824 (I)
2.6334 (I)
3.6599 (I)
4.66 #a 2.52 ˆa
–
# G 0 W 0 from a Ref. [55] b Ref .[56]; ˆ PBE from a Ref. [55] b Ref.[57] c Ref. [58]; *From Ref. [53]
based on UV-Vis spectroscopy
All values calculated here are based on a localised basis set E g are labelled as direct (D) or indirect
(I) band gaps
4 Vibrational Up-Pumping in Some Molecular Energetic Materials
the UV-V is spectra should offer a good indication as to the validity of the calculated
E g values. Furthermore, it should be noted that α-FOX-7 and TATB are both yellow
powders, with the former being more strongly coloured. This indicates an optical
transition in the region of ca. 2.6 eV for both materials.
The values of E g calculated for the series of molecular energetic compounds are
given in Table 4.3 (Note TATP was omitted from this part of the study as the large
unit cell renders the band structure calculation intractable). The B3PW91 functional
consistently predicts values of E g that are slightly higher than HSE06 results, ranging
from E g (HSE06) + 0.24 eV to E g (HSE06) + 0.32 eV. Hence it appears that on
average, the B3PW91 results should be within the same approximate accuracy as
the HSE06 results for related systems. As is expected, the PBE calculations return
considerably lower E g values than the higher level functionals. Literature values for
PBE-based calculations in Table 4.3 differ only slightly from those calculated here.
This is most notable for β-HMX, although literature reports are based on planewave basis sets (which contrasts with the localised basis sets used in this work). In
all cases, the G 0 W 0 calculations found in the literature suggest a larger band gap
than calculated by either B3PW91 or HSE06. Given the limited experimental values,
and noting the colour of the TATB and FOX-7 materials, it can be inferred that
G 0 W 0 quasi-particle methods may be overestimating the values of E g . This has been
demonstrated previously for inorganic systems [51].
As was noted for the azide materials in Chap. 3, there is no visible trend in the
band gap values and the reported impact sensitivity of these compounds. Based on the
B3PW91 or HSE06 calculations, the predicted sensitivity ordering would be NTO
> α-FOX-7 ≈ HNB ≈ TATB > ABT > β-HMX > HBT. This is clearly incorrect
when compared to experimental sensitivity ordering. Moreover, the agreement with
the experimental ordering worsens if the values from G 0 W 0 are considered. As was
also observed for the azide materials, there is no evidence of any correlation between
sensitivity and a material having a direct or indirect band gap.
Table 4.3 Fundamental electronic band gaps (E g ) in the crystalline molecular energetic materials,
arranged in order of decreasing impact sensitivity. Values are given in eV
Material
B3PW91
PBE
HSE06
Lit. Calc
Lit. Exp.
ABT
5.0317 (I)
2.9982 (I)
4.7882 (I)
–
–
HNB
3.9433 (I)
2.1040 (I)
3.6887 (D)
–
–
β-HMX
5.4954 (D)
3.6826 (I)
5.2176 (D)
7.21 #a 4.66 ˆa
5.32*
HBT
5.9569 (I)
4.2069 (I)
5.6364 (I)
–
–
α-FOX-7
3.9833 (I)
2.4483 (I)
3.6719 (I)
5.1 #,b 2.2 ˆ,c 1.9 ˆ,b
–
NTO
3.5024 (I)
2.1027 (D)
3.1892 (I)
–
–
TATB
3.9824 (I)
2.6334 (I)
3.6599 (I)
4.66 #a 2.52 ˆa
–
# G 0 W 0 from a Ref. [55] b Ref .[56]; ˆ PBE from a Ref. [55] b Ref.[57] c Ref. [58]; *From Ref. [53]
based on UV-Vis spectroscopy
All values calculated here are based on a localised basis set E g are labelled as direct (D) or indirect
(I) band gaps