

3.5 Results and Discussion
83
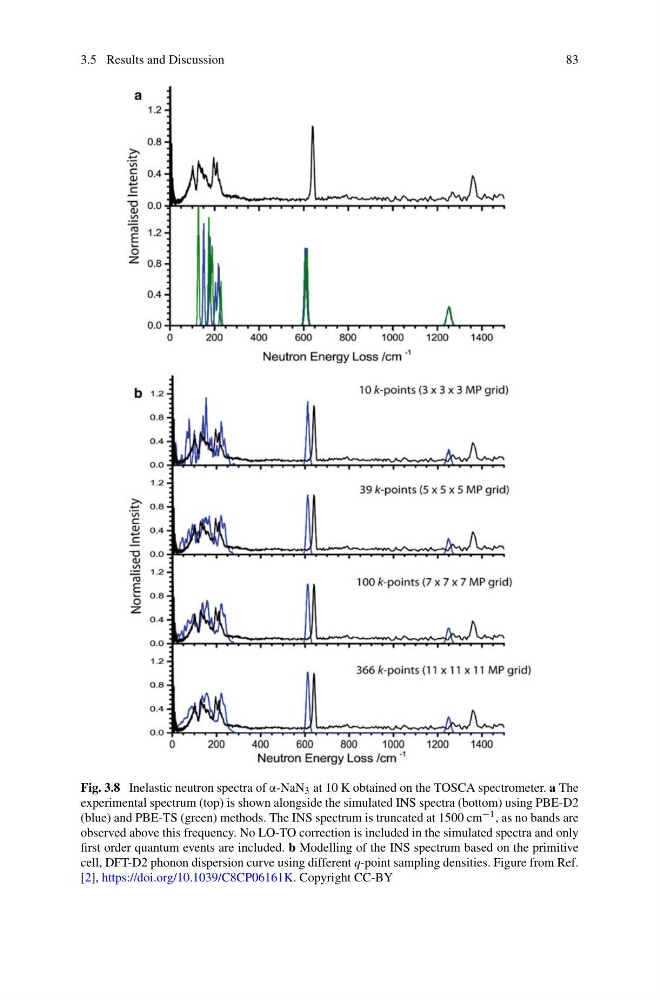
Fig. 3.8 Inelastic neutron spectra of α-NaN 3 at 10 K obtained on the TOSCA spectrometer. a The
experimental spectrum (top) is shown alongside the simulated INS spectra (bottom) using PBE-D2
(blue) and PBE-TS (green) methods. The INS spectrum is truncated at 1500 cm −1 , as no bands are
observed above this frequency. No LO-TO correction is included in the simulated spectra and only
first order quantum events are included. b Modelling of the INS spectrum based on the primitive
cell, DFT-D2 phonon dispersion curve using different q-point sampling densities. Figure from Ref.
[2], https://doi.org/10.1039/C8CP06161K. Copyright CC-BY
83
Fig. 3.8 Inelastic neutron spectra of α-NaN 3 at 10 K obtained on the TOSCA spectrometer. a The
experimental spectrum (top) is shown alongside the simulated INS spectra (bottom) using PBE-D2
(blue) and PBE-TS (green) methods. The INS spectrum is truncated at 1500 cm −1 , as no bands are
observed above this frequency. No LO-TO correction is included in the simulated spectra and only
first order quantum events are included. b Modelling of the INS spectrum based on the primitive
cell, DFT-D2 phonon dispersion curve using different q-point sampling densities. Figure from Ref.
[2], https://doi.org/10.1039/C8CP06161K. Copyright CC-BY