

72
3 Vibrational Up-Pumping: Predicting Impact Sensitivity of Some …
Table 3.3 Comparison of experimental (exp) and computed (calc) unit cell geometries. Low
temperature experimental data are used where available
Azide
a/Å
b/Å
c/Å
α/ o
β/ o
γ/ o
V/Å 3
V/(%)
AgN 3 (Exp)
5.60
5.98
5.99
90.00
90.00 90.00 200.86 +1.5
AgN 3 (Calc)
5.71
5.96
5.98
90.00
90.00 90.00 203.81
Ba(N 3 ) 2 (Exp)
9.59
4.39
5.42
90.00
99.75 90.00 224.89 +6
Ba(N 3 ) 2 (Calc) 9.83
4.44
5.53
90.00
99.14 90.00 238.50
HN 3 (Exp)
8.21
8.21
6.78 110.42 110.42 90.01 397.42 +5.9
HN 3 (Calc)
8.38
8.38
6.90 110.51 110.51 90.00 421.18
NH 4 N 3 (Exp)
8.93
3.81
8.66
90.00
90.00 90.00 294.62 +0.1
NH 4 N 3 (Calc)
9.02
3.81
8.57
90.00
90.00 90.00 294.80
LiN 3 (Exp)
5.63
3.32
4.98
90.00 107.40 90.00
88.73
-0.5
LiN 3 (Calc)
5.59
3.32
4.91
90.00 104.80 90.00
88.25
NaN 3 (Exp)
3.61
3.61
5.41 105.36 105.36 60.96
57.30 +1.1
NaN 3 (Calc)
3.59
3.59
5.20 101.81 101.82 61.76
57.94
Sn(N 3 ) 2 (Exp)
6.78 11.06
6.23
90.00
94.67 90.00 465.51 +0.7
Sn(N 3 ) 2 (Calc)
6.69 11.80
5.95
90.00
91.41 90.00 468.93
TAGZ (Exp)
6.68
7.72 13.14
90.00
95.44 13.14 674.80 +0.5
TAGZ (Calc)
6.69
7.74 13.16
90.00
95.76 90.00 678.39
Zn(N 3 ) 2 (Exp)
3.46 16.26
6.93
90.0
95.90 90.0
387.80 +1.5
Zn(N 3 ) 2 (Calc) 3.44 16.47
6.99
90.0
96.42 90.0
393.84
was sampled on a Monkhorst-Pack k-point grid [61] with spacing no greater than 0.05
Å
−1 . Note that tighter convergence was required for the Zn structure to remove imaginary phonon frequencies. Norm-conserving pseudopotentials were used throughout.
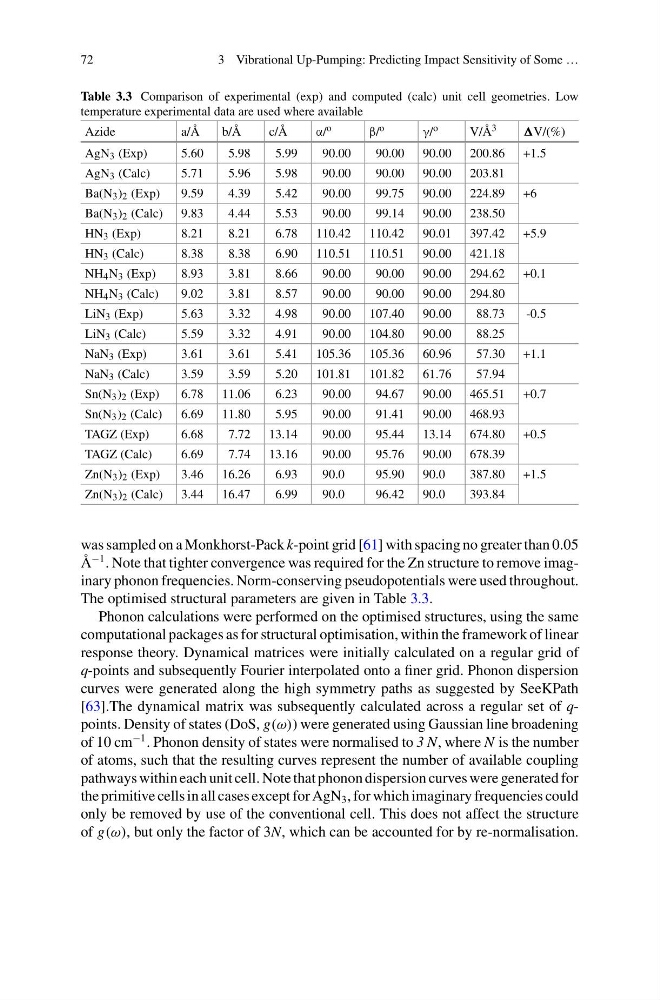
The optimised structural parameters are given in Table 3.3.
Phonon calculations were performed on the optimised structures, using the same
computational packages as for structural optimisation, within the framework of linear
response theory. Dynamical matrices were initially calculated on a regular grid of
q-points and subsequently Fourier interpolated onto a finer grid. Phonon dispersion
curves were generated along the high symmetry paths as suggested by SeeKPath
[63].The dynamical matrix was subsequently calculated across a regular set of qpoints. Density of states (DoS, g(ω)) were generated using Gaussian line broadening
of 10 cm
−1 . Phonon density of states were normalised to 3 N, where N is the number
of atoms, such that the resulting curves represent the number of available coupling
pathways within each unit cell. Note that phonon dispersion curves were generated for
the primitive cells in all cases except for AgN 3 , for which imaginary frequencies could
only be removed by use of the conventional cell. This does not affect the structure
of g(ω), but only the factor of 3N, which can be accounted for by re-normalisation.
3 Vibrational Up-Pumping: Predicting Impact Sensitivity of Some …
Table 3.3 Comparison of experimental (exp) and computed (calc) unit cell geometries. Low
temperature experimental data are used where available
Azide
a/Å
b/Å
c/Å
α/ o
β/ o
γ/ o
V/Å 3
V/(%)
AgN 3 (Exp)
5.60
5.98
5.99
90.00
90.00 90.00 200.86 +1.5
AgN 3 (Calc)
5.71
5.96
5.98
90.00
90.00 90.00 203.81
Ba(N 3 ) 2 (Exp)
9.59
4.39
5.42
90.00
99.75 90.00 224.89 +6
Ba(N 3 ) 2 (Calc) 9.83
4.44
5.53
90.00
99.14 90.00 238.50
HN 3 (Exp)
8.21
8.21
6.78 110.42 110.42 90.01 397.42 +5.9
HN 3 (Calc)
8.38
8.38
6.90 110.51 110.51 90.00 421.18
NH 4 N 3 (Exp)
8.93
3.81
8.66
90.00
90.00 90.00 294.62 +0.1
NH 4 N 3 (Calc)
9.02
3.81
8.57
90.00
90.00 90.00 294.80
LiN 3 (Exp)
5.63
3.32
4.98
90.00 107.40 90.00
88.73
-0.5
LiN 3 (Calc)
5.59
3.32
4.91
90.00 104.80 90.00
88.25
NaN 3 (Exp)
3.61
3.61
5.41 105.36 105.36 60.96
57.30 +1.1
NaN 3 (Calc)
3.59
3.59
5.20 101.81 101.82 61.76
57.94
Sn(N 3 ) 2 (Exp)
6.78 11.06
6.23
90.00
94.67 90.00 465.51 +0.7
Sn(N 3 ) 2 (Calc)
6.69 11.80
5.95
90.00
91.41 90.00 468.93
TAGZ (Exp)
6.68
7.72 13.14
90.00
95.44 13.14 674.80 +0.5
TAGZ (Calc)
6.69
7.74 13.16
90.00
95.76 90.00 678.39
Zn(N 3 ) 2 (Exp)
3.46 16.26
6.93
90.0
95.90 90.0
387.80 +1.5
Zn(N 3 ) 2 (Calc) 3.44 16.47
6.99
90.0
96.42 90.0
393.84
was sampled on a Monkhorst-Pack k-point grid [61] with spacing no greater than 0.05
Å
−1 . Note that tighter convergence was required for the Zn structure to remove imaginary phonon frequencies. Norm-conserving pseudopotentials were used throughout.
The optimised structural parameters are given in Table 3.3.
Phonon calculations were performed on the optimised structures, using the same
computational packages as for structural optimisation, within the framework of linear
response theory. Dynamical matrices were initially calculated on a regular grid of
q-points and subsequently Fourier interpolated onto a finer grid. Phonon dispersion
curves were generated along the high symmetry paths as suggested by SeeKPath
[63].The dynamical matrix was subsequently calculated across a regular set of qpoints. Density of states (DoS, g(ω)) were generated using Gaussian line broadening
of 10 cm
−1 . Phonon density of states were normalised to 3 N, where N is the number
of atoms, such that the resulting curves represent the number of available coupling
pathways within each unit cell. Note that phonon dispersion curves were generated for
the primitive cells in all cases except for AgN 3 , for which imaginary frequencies could
only be removed by use of the conventional cell. This does not affect the structure
of g(ω), but only the factor of 3N, which can be accounted for by re-normalisation.