

The total uncertainty of the elemental analysis was determined using the TE
sclerotia sample by two-way analysis of variance (ANOVA). The ICP analysis
(ICP-MS, ICP-OES) proceeds in three major steps: sample introduction, sample
digestion, and measurement. As it is instructive to evaluate the magnitude of the
variance in experimental results introduced during each step, the dispersion or
relative standard deviation of individual samples around the mean was measured
as the variance (S
2 ) according to Montgomery (1911).
The variance or relative standard deviation (S rΣ ) was calculated according to
Eq. (11.1).
S
2
r
P ¼
ffiffiffiffiffiffiffiffiffiffiffiffiffiffiffiffiffiffiffiffiffiffiffiffiffiffi ffi
S
2
rr þ S
2
rt þ S
2
rs
q
ð11:1Þ
where S
2
rr is the repeatability of analytical results for the solutions and depends on
instrumentation stability, S
2
rt is sample portions, S
2
rs is the quality of the solutions
prepared from sclerotia samples including homogenization. Four replicates of sclerotia sample were prepared to isolate these error components. Each solution was
measured in triplicate, with the sample positioned independently in the spectrometer.
11.3 Results and Discussion
11.3.1 Soil Properties
Soil conditions, such as pH and organic matter, can influence metal assimilation by
plant roots by affecting root growth and the mobility of pollutants (Ross 1994). The
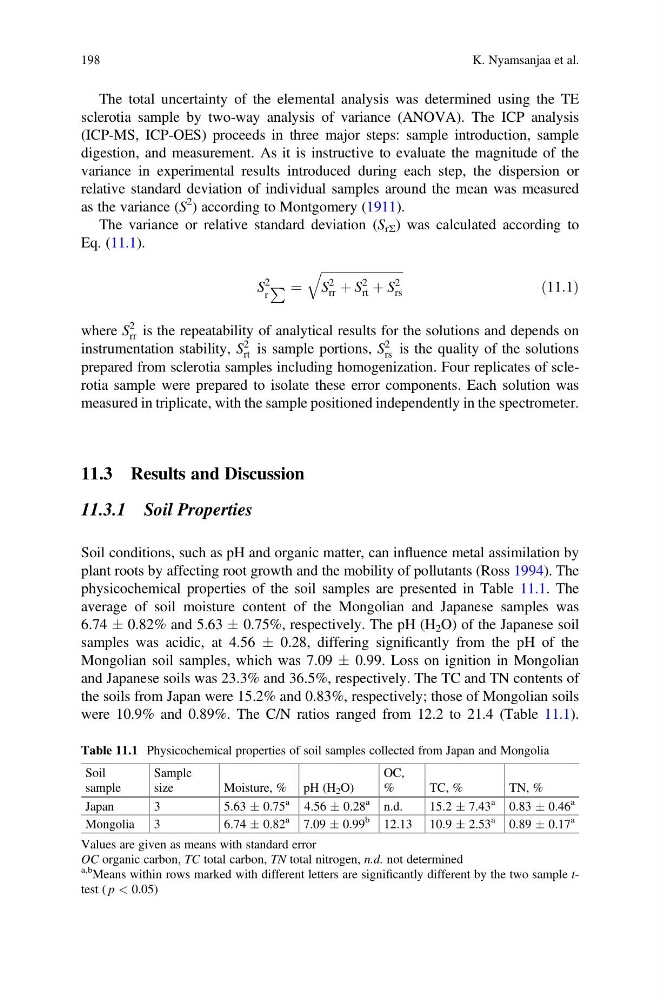
physicochemical properties of the soil samples are presented in Table 11.1. The
average of soil moisture content of the Mongolian and Japanese samples was
6.74 Æ 0.82% and 5.63 Æ 0.75%, respectively. The pH (H 2 O) of the Japanese soil
samples was acidic, at 4.56 Æ 0.28, differing significantly from the pH of the
Mongolian soil samples, which was 7.09 Æ 0.99. Loss on ignition in Mongolian
and Japanese soils was 23.3% and 36.5%, respectively. The TC and TN contents of
the soils from Japan were 15.2% and 0.83%, respectively; those of Mongolian soils
were 10.9% and 0.89%. The C/N ratios ranged from 12.2 to 21.4 (Table 11.1).
Table 11.1 Physicochemical properties of soil samples collected from Japan and Mongolia
Soil
sample
Sample
size
Moisture, % pH (H 2 O)
OC,
%
TC, %
TN, %
Japan
3
5.63 Æ 0.75
a
4.56 Æ 0.28
a
n.d.
15.2 Æ 7.43
a
0.83 Æ 0.46
a
Mongolia
3
6.74 Æ 0.82
a
7.09 Æ 0.99
b
12.13 10.9 Æ 2.53
a
0.89 Æ 0.17
a
Values are given as means with standard error
OC organic carbon, TC total carbon, TN total nitrogen, n.d. not determined
a,b Means within rows marked with different letters are significantly different by the two sample ttest ( p < 0.05)
198
K. Nyamsanjaa et al.
sclerotia sample by two-way analysis of variance (ANOVA). The ICP analysis
(ICP-MS, ICP-OES) proceeds in three major steps: sample introduction, sample
digestion, and measurement. As it is instructive to evaluate the magnitude of the
variance in experimental results introduced during each step, the dispersion or
relative standard deviation of individual samples around the mean was measured
as the variance (S
2 ) according to Montgomery (1911).
The variance or relative standard deviation (S rΣ ) was calculated according to
Eq. (11.1).
S
2
r
P ¼
ffiffiffiffiffiffiffiffiffiffiffiffiffiffiffiffiffiffiffiffiffiffiffiffiffiffi ffi
S
2
rr þ S
2
rt þ S
2
rs
q
ð11:1Þ
where S
2
rr is the repeatability of analytical results for the solutions and depends on
instrumentation stability, S
2
rt is sample portions, S
2
rs is the quality of the solutions
prepared from sclerotia samples including homogenization. Four replicates of sclerotia sample were prepared to isolate these error components. Each solution was
measured in triplicate, with the sample positioned independently in the spectrometer.
11.3 Results and Discussion
11.3.1 Soil Properties
Soil conditions, such as pH and organic matter, can influence metal assimilation by
plant roots by affecting root growth and the mobility of pollutants (Ross 1994). The
physicochemical properties of the soil samples are presented in Table 11.1. The
average of soil moisture content of the Mongolian and Japanese samples was
6.74 Æ 0.82% and 5.63 Æ 0.75%, respectively. The pH (H 2 O) of the Japanese soil
samples was acidic, at 4.56 Æ 0.28, differing significantly from the pH of the
Mongolian soil samples, which was 7.09 Æ 0.99. Loss on ignition in Mongolian
and Japanese soils was 23.3% and 36.5%, respectively. The TC and TN contents of
the soils from Japan were 15.2% and 0.83%, respectively; those of Mongolian soils
were 10.9% and 0.89%. The C/N ratios ranged from 12.2 to 21.4 (Table 11.1).
Table 11.1 Physicochemical properties of soil samples collected from Japan and Mongolia
Soil
sample
Sample
size
Moisture, % pH (H 2 O)
OC,
%
TC, %
TN, %
Japan
3
5.63 Æ 0.75
a
4.56 Æ 0.28
a
n.d.
15.2 Æ 7.43
a
0.83 Æ 0.46
a
Mongolia
3
6.74 Æ 0.82
a
7.09 Æ 0.99
b
12.13 10.9 Æ 2.53
a
0.89 Æ 0.17
a
Values are given as means with standard error
OC organic carbon, TC total carbon, TN total nitrogen, n.d. not determined
a,b Means within rows marked with different letters are significantly different by the two sample ttest ( p < 0.05)
198
K. Nyamsanjaa et al.