

22 (40
39
0 07
00 N, 140
17
0 26
00 E; 1156 m asl.) on July and September 2006
(Fig. 9.10a). The vegetation of the pediment area of Mt. Iwaki was secondary forest
(mainly Q. serrata, Fig. 9.10b) and points 4–7 and 14–21 were F. crenata forest
(Fig. 9.10c), and higher points were occupied with Betula ermanii, Alnus
maximowiczii, or S. kurilensis (Fig. 9.10d). As for Mt. Ontake, soil samples were
taken from 16 points (35
55
0 29
00 N, 137
26
0 41
00 E; 1715 m asl.–35
54
0 37
00 N,
137
28
0 59
00 E; 2770 m asl.) along a trail on June 2006 (Fig. 9.11a). The main
vegetations were B. ermanii at point 1, and A. veitchii or T. diversifolia at points
2–11 (Fig. 9.11b, c). The timber line was around point 12, and higher regions were
covered with P. pumila (Fig. 9.11d). In addition, Warmth Index (WI) for all points
was calculated according to Kira (1976), using the Mesh Climatic Data 2000 (Japan
Meteorological Agency 2002).
The distribution of sclerotia at Mt. Iwaki and Mt. Ontake are summarized in
Figs. 9.12 and 9.13. The averages of weight density of sclerotia for Mt. Iwaki and
Mt. Ontake were 0.80 mg/g and 0.81 mg/g, respectively. There was a clear peak of
sclerotia content at point 5 for the weight density (2.5 mg/g) and at point 6 for the
count density (25 grain/g) in F. crenata forest of Mt. Iwaki 1. As for Mt. Iwaki 2, two
peaks of weight density were observed around the boundary area of F. crenata forest
(points 13, 14 and 20, 21). A relatively low weight and low count of sclerotia was
observed at point 16, where C. japonica locally dominated, compared to the
surrounding area. Sclerotia of Mt. Ontake tended to be large compared to those of
Mt. Iwaki. Three distributional peaks were recognized at points 1, 8, and 15 on
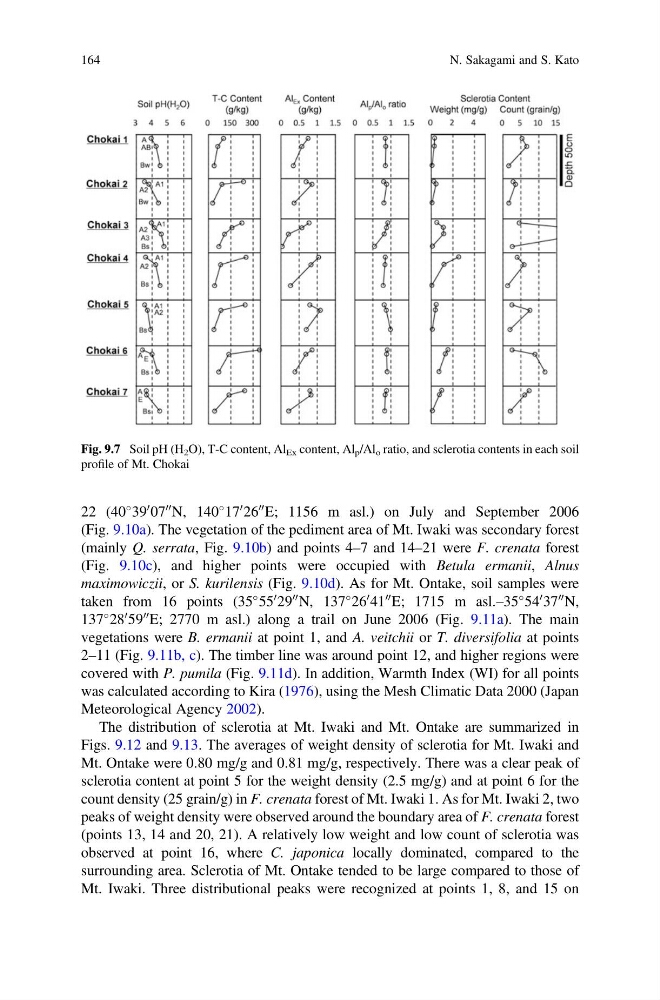
Fig. 9.7 Soil pH (H 2 O), T-C content, Al Ex content, Al p /Al o ratio, and sclerotia contents in each soil
profile of Mt. Chokai
164
N. Sakagami and S. Kato
39
0 07
00 N, 140
17
0 26
00 E; 1156 m asl.) on July and September 2006
(Fig. 9.10a). The vegetation of the pediment area of Mt. Iwaki was secondary forest
(mainly Q. serrata, Fig. 9.10b) and points 4–7 and 14–21 were F. crenata forest
(Fig. 9.10c), and higher points were occupied with Betula ermanii, Alnus
maximowiczii, or S. kurilensis (Fig. 9.10d). As for Mt. Ontake, soil samples were
taken from 16 points (35
55
0 29
00 N, 137
26
0 41
00 E; 1715 m asl.–35
54
0 37
00 N,
137
28
0 59
00 E; 2770 m asl.) along a trail on June 2006 (Fig. 9.11a). The main
vegetations were B. ermanii at point 1, and A. veitchii or T. diversifolia at points
2–11 (Fig. 9.11b, c). The timber line was around point 12, and higher regions were
covered with P. pumila (Fig. 9.11d). In addition, Warmth Index (WI) for all points
was calculated according to Kira (1976), using the Mesh Climatic Data 2000 (Japan
Meteorological Agency 2002).
The distribution of sclerotia at Mt. Iwaki and Mt. Ontake are summarized in
Figs. 9.12 and 9.13. The averages of weight density of sclerotia for Mt. Iwaki and
Mt. Ontake were 0.80 mg/g and 0.81 mg/g, respectively. There was a clear peak of
sclerotia content at point 5 for the weight density (2.5 mg/g) and at point 6 for the
count density (25 grain/g) in F. crenata forest of Mt. Iwaki 1. As for Mt. Iwaki 2, two
peaks of weight density were observed around the boundary area of F. crenata forest
(points 13, 14 and 20, 21). A relatively low weight and low count of sclerotia was
observed at point 16, where C. japonica locally dominated, compared to the
surrounding area. Sclerotia of Mt. Ontake tended to be large compared to those of
Mt. Iwaki. Three distributional peaks were recognized at points 1, 8, and 15 on
Fig. 9.7 Soil pH (H 2 O), T-C content, Al Ex content, Al p /Al o ratio, and sclerotia contents in each soil
profile of Mt. Chokai
164
N. Sakagami and S. Kato