

the latter were 150 and 190 cm, respectively. Flower petals were separated off from
these samples during air-drying. Paddy rice and barley were mature whole top after
threshing.
Leaf and needle tissue accounts for a great proportion in total above-ground litter
fall, 74, 81, and 62% for temperate deciduous broad-leaved forest, temperate
coniferous forest, and subalpine coniferous forest of Japan, respectively (Tsutsumi
1973). The contribution of herbaceous vegetation to litter fall amounts to less than
5% in forests of the temperate zone (Kögel-Knabner 2002).
The predominant saccharides of herbaceous plant materials sampled were
NEH-glucose and xylose (Fig. 6.2). The proportion of EH-glucose was much smaller
than xylose. Galactose and mannose constituted only small proportion, 1.3 and
0.98% in average, respectively.
In comparison to herbaceous plants, the three coniferous trees sampled contained
a larger proportion of galactose, mannose, and arabinose (Fig. 6.2). The fallen trunk
of coniferous tree contained a larger proportion of NEH-glucose than the shoots of
other coniferous species. Mannose of the tree trunk tended to occupy larger proportion than that of other three coniferous shoots. Some portion of the mannose may
originate from microorganisms including wood-rotting fungi, as the trunk had been
weathered. Leaf litter of deciduous species, Japanese white birch, contained a much
smaller proportion of mannose than shoots of the coniferous trees. The hemicelluloses of broad-leaved trees, grasses, and herbs contained much smaller proportion of
mannose across different tissues (leaves, sapwood, bark, roots) than hemicelluloses
of needles, sapwood, and bark of conifer (Shädel et al. 2010). The proportion of
xylose was vice versa of mannose.
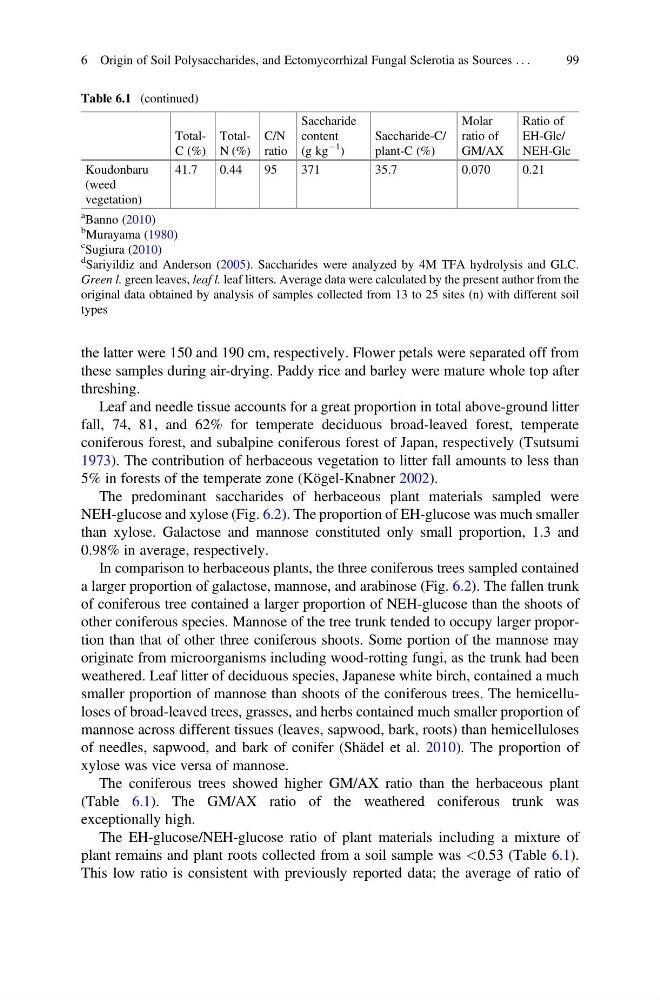
The coniferous trees showed higher GM/AX ratio than the herbaceous plant
(Table 6.1). The GM/AX ratio of the weathered coniferous trunk was
exceptionally high.
The EH-glucose/NEH-glucose ratio of plant materials including a mixture of
plant remains and plant roots collected from a soil sample was <0.53 (Table 6.1).
This low ratio is consistent with previously reported data; the average of ratio of
Table 6.1 (continued)
TotalC (%)
TotalN (%)
C/N
ratio
Saccharide
content
(g kg
À1
)
Saccharide-C/
plant-C (%)
Molar
ratio of
GM/AX
Ratio of
EH-Glc/
NEH-Glc
Koudonbaru
(weed
vegetation)
41.7
0.44
95
371
35.7
0.070
0.21
a Banno (2010)
b
Murayama (1980)
c Sugiura (2010)
d
Sariyildiz and Anderson (2005). Saccharides were analyzed by 4M TFA hydrolysis and GLC.
Green l. green leaves, leaf l. leaf litters. Average data were calculated by the present author from the
original data obtained by analysis of samples collected from 13 to 25 sites (n) with different soil
types
6 Origin of Soil Polysaccharides, and Ectomycorrhizal Fungal Sclerotia as Sources . . .
99
these samples during air-drying. Paddy rice and barley were mature whole top after
threshing.
Leaf and needle tissue accounts for a great proportion in total above-ground litter
fall, 74, 81, and 62% for temperate deciduous broad-leaved forest, temperate
coniferous forest, and subalpine coniferous forest of Japan, respectively (Tsutsumi
1973). The contribution of herbaceous vegetation to litter fall amounts to less than
5% in forests of the temperate zone (Kögel-Knabner 2002).
The predominant saccharides of herbaceous plant materials sampled were
NEH-glucose and xylose (Fig. 6.2). The proportion of EH-glucose was much smaller
than xylose. Galactose and mannose constituted only small proportion, 1.3 and
0.98% in average, respectively.
In comparison to herbaceous plants, the three coniferous trees sampled contained
a larger proportion of galactose, mannose, and arabinose (Fig. 6.2). The fallen trunk
of coniferous tree contained a larger proportion of NEH-glucose than the shoots of
other coniferous species. Mannose of the tree trunk tended to occupy larger proportion than that of other three coniferous shoots. Some portion of the mannose may
originate from microorganisms including wood-rotting fungi, as the trunk had been
weathered. Leaf litter of deciduous species, Japanese white birch, contained a much
smaller proportion of mannose than shoots of the coniferous trees. The hemicelluloses of broad-leaved trees, grasses, and herbs contained much smaller proportion of
mannose across different tissues (leaves, sapwood, bark, roots) than hemicelluloses
of needles, sapwood, and bark of conifer (Shädel et al. 2010). The proportion of
xylose was vice versa of mannose.
The coniferous trees showed higher GM/AX ratio than the herbaceous plant
(Table 6.1). The GM/AX ratio of the weathered coniferous trunk was
exceptionally high.
The EH-glucose/NEH-glucose ratio of plant materials including a mixture of
plant remains and plant roots collected from a soil sample was <0.53 (Table 6.1).
This low ratio is consistent with previously reported data; the average of ratio of
Table 6.1 (continued)
TotalC (%)
TotalN (%)
C/N
ratio
Saccharide
content
(g kg
À1
)
Saccharide-C/
plant-C (%)
Molar
ratio of
GM/AX
Ratio of
EH-Glc/
NEH-Glc
Koudonbaru
(weed
vegetation)
41.7
0.44
95
371
35.7
0.070
0.21
a Banno (2010)
b
Murayama (1980)
c Sugiura (2010)
d
Sariyildiz and Anderson (2005). Saccharides were analyzed by 4M TFA hydrolysis and GLC.
Green l. green leaves, leaf l. leaf litters. Average data were calculated by the present author from the
original data obtained by analysis of samples collected from 13 to 25 sites (n) with different soil
types
6 Origin of Soil Polysaccharides, and Ectomycorrhizal Fungal Sclerotia as Sources . . .
99