

hydrocarbon fueled SOFC. This is supported by Azzolini
et al. (2015) wherein tubular SOFC with anode contains
copper-GDC and GDC electrolyte system, maximum of
0.008 W cm
−2 power density was achieved which is far
lower than common value. This is further clarified by study
from Sumi et al. (2015) with anode containing Nickel-GDC
and GDC electrolyte where maximum power density
0.25 W cm
−2 was obtained using H 2 fuel.
Co-extrusion of dual-layer hollow fiber to produce SOFC
by Omar et al. (2018) and Jamil et al. (2019) shown that
even though the SOFC was produced with the same composition of anode/electrolyte/cathode of Ni-GDC/GDC/
LSCF-GDC, different performance SOFC can be obtained
when tested on the same fuel H 2 . The difference in result of
0.67 and 0.29 W cm
−2 by Omar et al. (2018) and Jamil et al.
(2019) may be attributed to the higher porosity (between
31.5 and 52.5%) in later compared to the former (25.6%).
Omar et al. (2018) also tested the SOFC on CH 4 gas,
obtaining a lower performance of 0.22 W cm
−2 compared to
running on H 2 . This suggests that not only the material is
important but also the microstructure is similar importance
for the performance of SOFC.
Co-extrusion of triple-layer HF containing complete
anode/electrolyte/cathode layer in single step by Jamil et al.
(2018) produced roughly the same power density as the
SOFC from dual-layer HF. With anode/electrolyte/cathode
consisting of Ni-GDC/GDC/LSCF-GDC each, maximum
power density was obtained at 0.48 W cm
−2 running on H 2 ,
Table 1 Recent literature on
SOFC tested with H 2 and CH 4
fuel
Source
Support
Fabrication technique
Type
Power density
(W/cm
2
)
H 2
CH 4
Akdeniz et al. (2016)
Electrolyte
Tape casting
P-SOFC
0.23
0.15
Bochentyn et al. (2019)
Electrolyte
Commercial (pressed)
a
P-SOFC
0.24
0.21
Harris et al. (2017)
Electrolyte
Commercial (pressed)
a
P-SOFC
0.323
0.245
Hua et al. (2018)
Electrolyte
Pressed
P-SOFC
1.06
0.94
Lee et al. (2016)
Electrolyte
Pressed
P-SOFC
1.7
1.4
Li et al. (2019)
Electrolyte
Commercial (pressed)
a
P-SOFC
0.6
0.6
Meng et al. (2014)
Anode
Extrusion/phase inversion
MT-SOFC
0.15
0.24
Omar et al. (2018)
Anode
Extrusion/phase inversion
MT-SOFC
0.67
0.22
Panthi et al. (2017b)
Electrolyte
Ram extrusion
MT-SOFC
0.75
0.55
Rabuni et al. (2018)
Anode
Extrusion/phase inversion
MT-SOFC
0.55
0.16
Sarruf et al. (2017)
Electrolyte
Commercial (pressed)
a
P-SOFC
0.383
0.088
Sarruf et al. (2018)
Electrolyte
Commercial (pressed)
a
P-SOFC
0.411
0.082
Sumi et al. (2015)
Anode
Ram extrusion
MT-SOFC
0.14
0.14
Wu et al. (2016)
Anode
Tape casting
P-SOFC
0.463
0.251
Yan et al. (2016)
Electrolyte
Tape
P-SOFC
0.25
0.25
a Fuel cell which are usually available commercially in form of YSZ disk is included for reference
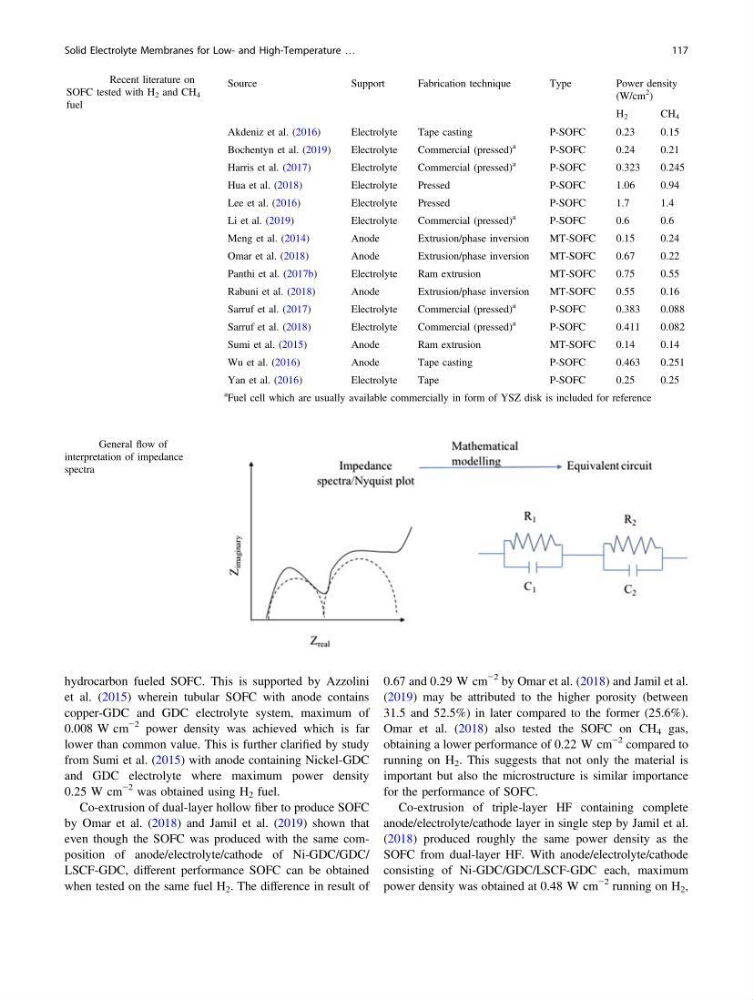
Fig. 5 General flow of
interpretation of impedance
spectra
Solid Electrolyte Membranes for Low- and High-Temperature …
117
et al. (2015) wherein tubular SOFC with anode contains
copper-GDC and GDC electrolyte system, maximum of
0.008 W cm
−2 power density was achieved which is far
lower than common value. This is further clarified by study
from Sumi et al. (2015) with anode containing Nickel-GDC
and GDC electrolyte where maximum power density
0.25 W cm
−2 was obtained using H 2 fuel.
Co-extrusion of dual-layer hollow fiber to produce SOFC
by Omar et al. (2018) and Jamil et al. (2019) shown that
even though the SOFC was produced with the same composition of anode/electrolyte/cathode of Ni-GDC/GDC/
LSCF-GDC, different performance SOFC can be obtained
when tested on the same fuel H 2 . The difference in result of
0.67 and 0.29 W cm
−2 by Omar et al. (2018) and Jamil et al.
(2019) may be attributed to the higher porosity (between
31.5 and 52.5%) in later compared to the former (25.6%).
Omar et al. (2018) also tested the SOFC on CH 4 gas,
obtaining a lower performance of 0.22 W cm
−2 compared to
running on H 2 . This suggests that not only the material is
important but also the microstructure is similar importance
for the performance of SOFC.
Co-extrusion of triple-layer HF containing complete
anode/electrolyte/cathode layer in single step by Jamil et al.
(2018) produced roughly the same power density as the
SOFC from dual-layer HF. With anode/electrolyte/cathode
consisting of Ni-GDC/GDC/LSCF-GDC each, maximum
power density was obtained at 0.48 W cm
−2 running on H 2 ,
Table 1 Recent literature on
SOFC tested with H 2 and CH 4
fuel
Source
Support
Fabrication technique
Type
Power density
(W/cm
2
)
H 2
CH 4
Akdeniz et al. (2016)
Electrolyte
Tape casting
P-SOFC
0.23
0.15
Bochentyn et al. (2019)
Electrolyte
Commercial (pressed)
a
P-SOFC
0.24
0.21
Harris et al. (2017)
Electrolyte
Commercial (pressed)
a
P-SOFC
0.323
0.245
Hua et al. (2018)
Electrolyte
Pressed
P-SOFC
1.06
0.94
Lee et al. (2016)
Electrolyte
Pressed
P-SOFC
1.7
1.4
Li et al. (2019)
Electrolyte
Commercial (pressed)
a
P-SOFC
0.6
0.6
Meng et al. (2014)
Anode
Extrusion/phase inversion
MT-SOFC
0.15
0.24
Omar et al. (2018)
Anode
Extrusion/phase inversion
MT-SOFC
0.67
0.22
Panthi et al. (2017b)
Electrolyte
Ram extrusion
MT-SOFC
0.75
0.55
Rabuni et al. (2018)
Anode
Extrusion/phase inversion
MT-SOFC
0.55
0.16
Sarruf et al. (2017)
Electrolyte
Commercial (pressed)
a
P-SOFC
0.383
0.088
Sarruf et al. (2018)
Electrolyte
Commercial (pressed)
a
P-SOFC
0.411
0.082
Sumi et al. (2015)
Anode
Ram extrusion
MT-SOFC
0.14
0.14
Wu et al. (2016)
Anode
Tape casting
P-SOFC
0.463
0.251
Yan et al. (2016)
Electrolyte
Tape
P-SOFC
0.25
0.25
a Fuel cell which are usually available commercially in form of YSZ disk is included for reference
Fig. 5 General flow of
interpretation of impedance
spectra
Solid Electrolyte Membranes for Low- and High-Temperature …
117