

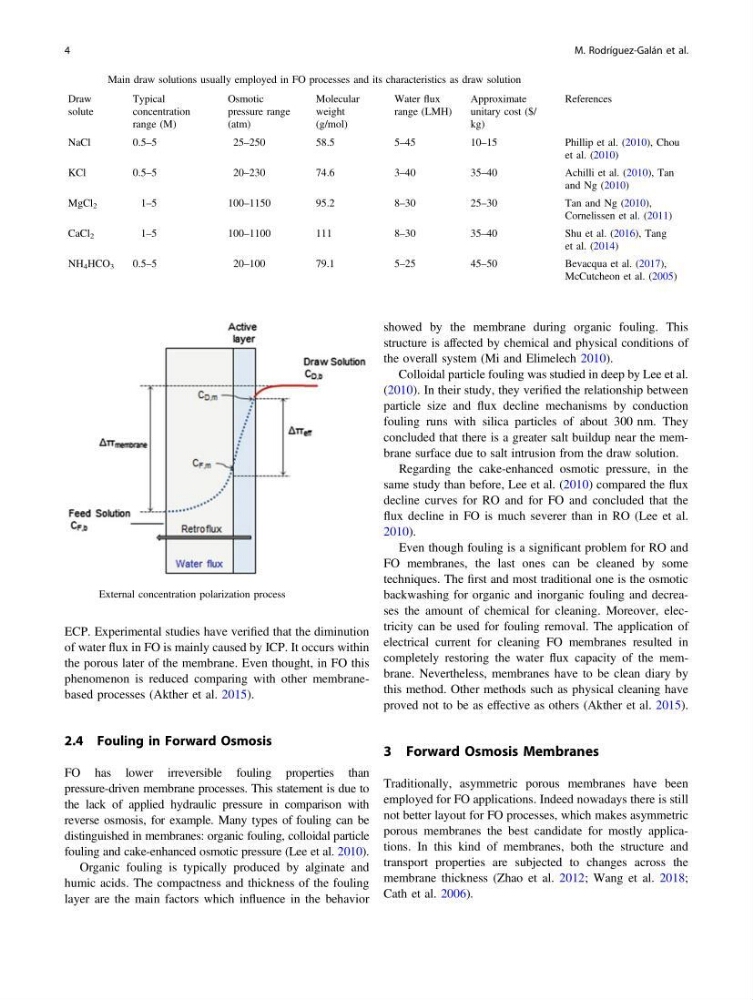
ECP. Experimental studies have verified that the diminution
of water flux in FO is mainly caused by ICP. It occurs within
the porous later of the membrane. Even thought, in FO this
phenomenon is reduced comparing with other membranebased processes (Akther et al. 2015).
2.4 Fouling in Forward Osmosis
FO has lower irreversible fouling properties than
pressure-driven membrane processes. This statement is due to
the lack of applied hydraulic pressure in comparison with
reverse osmosis, for example. Many types of fouling can be
distinguished in membranes: organic fouling, colloidal particle
fouling and cake-enhanced osmotic pressure (Lee et al. 2010).
Organic fouling is typically produced by alginate and
humic acids. The compactness and thickness of the fouling
layer are the main factors which influence in the behavior
showed by the membrane during organic fouling. This
structure is affected by chemical and physical conditions of
the overall system (Mi and Elimelech 2010).
Colloidal particle fouling was studied in deep by Lee et al.
(2010). In their study, they verified the relationship between
particle size and flux decline mechanisms by conduction
fouling runs with silica particles of about 300 nm. They
concluded that there is a greater salt buildup near the membrane surface due to salt intrusion from the draw solution.
Regarding the cake-enhanced osmotic pressure, in the
same study than before, Lee et al. (2010) compared the flux
decline curves for RO and for FO and concluded that the
flux decline in FO is much severer than in RO (Lee et al.
2010).
Even though fouling is a significant problem for RO and
FO membranes, the last ones can be cleaned by some
techniques. The first and most traditional one is the osmotic
backwashing for organic and inorganic fouling and decreases the amount of chemical for cleaning. Moreover, electricity can be used for fouling removal. The application of
electrical current for cleaning FO membranes resulted in
completely restoring the water flux capacity of the membrane. Nevertheless, membranes have to be clean diary by
this method. Other methods such as physical cleaning have
proved not to be as effective as others (Akther et al. 2015).
3 Forward Osmosis Membranes
Traditionally, asymmetric porous membranes have been
employed for FO applications. Indeed nowadays there is still
not better layout for FO processes, which makes asymmetric
porous membranes the best candidate for mostly applications. In this kind of membranes, both the structure and
transport properties are subjected to changes across the
membrane thickness (Zhao et al. 2012; Wang et al. 2018;
Cath et al. 2006).
Table 1 Main draw solutions usually employed in FO processes and its characteristics as draw solution
Draw
solute
Typical
concentration
range (M)
Osmotic
pressure range
(atm)
Molecular
weight
(g/mol)
Water flux
range (LMH)
Approximate
unitary cost ($/
kg)
References
NaCl
0.5–5
2 5 –250
58.5
5–45
10–15
Phillip et al. (2010), Chou
et al. (2010)
KCl
0.5–5
2 0 –230
74.6
3–40
35–40
Achilli et al. (2010), Tan
and Ng (2010)
MgCl 2
1–5
100–1150
95.2
8–30
25–30
Tan and Ng (2010),
Cornelissen et al. (2011)
CaCl 2
1–5
100–1100
111
8–30
35–40
Shu et al. (2016), Tang
et al. (2014)
NH 4 HCO 3
0.5–5
2 0 –100
79.1
5–25
45–50
Bevacqua et al. (2017),
McCutcheon et al. (2005)
Fig. 3 External concentration polarization process
4
M. Rodríguez-Galán et al.
of water flux in FO is mainly caused by ICP. It occurs within
the porous later of the membrane. Even thought, in FO this
phenomenon is reduced comparing with other membranebased processes (Akther et al. 2015).
2.4 Fouling in Forward Osmosis
FO has lower irreversible fouling properties than
pressure-driven membrane processes. This statement is due to
the lack of applied hydraulic pressure in comparison with
reverse osmosis, for example. Many types of fouling can be
distinguished in membranes: organic fouling, colloidal particle
fouling and cake-enhanced osmotic pressure (Lee et al. 2010).
Organic fouling is typically produced by alginate and
humic acids. The compactness and thickness of the fouling
layer are the main factors which influence in the behavior
showed by the membrane during organic fouling. This
structure is affected by chemical and physical conditions of
the overall system (Mi and Elimelech 2010).
Colloidal particle fouling was studied in deep by Lee et al.
(2010). In their study, they verified the relationship between
particle size and flux decline mechanisms by conduction
fouling runs with silica particles of about 300 nm. They
concluded that there is a greater salt buildup near the membrane surface due to salt intrusion from the draw solution.
Regarding the cake-enhanced osmotic pressure, in the
same study than before, Lee et al. (2010) compared the flux
decline curves for RO and for FO and concluded that the
flux decline in FO is much severer than in RO (Lee et al.
2010).
Even though fouling is a significant problem for RO and
FO membranes, the last ones can be cleaned by some
techniques. The first and most traditional one is the osmotic
backwashing for organic and inorganic fouling and decreases the amount of chemical for cleaning. Moreover, electricity can be used for fouling removal. The application of
electrical current for cleaning FO membranes resulted in
completely restoring the water flux capacity of the membrane. Nevertheless, membranes have to be clean diary by
this method. Other methods such as physical cleaning have
proved not to be as effective as others (Akther et al. 2015).
3 Forward Osmosis Membranes
Traditionally, asymmetric porous membranes have been
employed for FO applications. Indeed nowadays there is still
not better layout for FO processes, which makes asymmetric
porous membranes the best candidate for mostly applications. In this kind of membranes, both the structure and
transport properties are subjected to changes across the
membrane thickness (Zhao et al. 2012; Wang et al. 2018;
Cath et al. 2006).
Table 1 Main draw solutions usually employed in FO processes and its characteristics as draw solution
Draw
solute
Typical
concentration
range (M)
Osmotic
pressure range
(atm)
Molecular
weight
(g/mol)
Water flux
range (LMH)
Approximate
unitary cost ($/
kg)
References
NaCl
0.5–5
2 5 –250
58.5
5–45
10–15
Phillip et al. (2010), Chou
et al. (2010)
KCl
0.5–5
2 0 –230
74.6
3–40
35–40
Achilli et al. (2010), Tan
and Ng (2010)
MgCl 2
1–5
100–1150
95.2
8–30
25–30
Tan and Ng (2010),
Cornelissen et al. (2011)
CaCl 2
1–5
100–1100
111
8–30
35–40
Shu et al. (2016), Tang
et al. (2014)
NH 4 HCO 3
0.5–5
2 0 –100
79.1
5–25
45–50
Bevacqua et al. (2017),
McCutcheon et al. (2005)
Fig. 3 External concentration polarization process
4
M. Rodríguez-Galán et al.