

to the local topography and meteorology. The
main direct impacts of primary pollutants are
near to the point of emission; further away, concentration decreases rapidly as a result of dispersion and dilution. However, many of the primary
pollutants react together, and with pollutants from
other sources, to form secondary pollutants.
Because of the time required for their formation,
the concentrations of secondary pollutants are not
always highest near the emission source.
The overall exposure of individuals to air pollutants is dependent upon the types of activity in
which they are engaged, the locations of those
activities, and the pollutant concentrations in
those locations. One way of determining “integrated” personal exposure is through the use of a
“microenvironment” model [24]. The term microenvironment describes a location with a distinct
level of pollution, such as outdoors in the street,
indoors at home, in transit, at the workplace,
etc. The fraction of time spent in each microenvironment allows the calculation of integrated exposure. However, the calculation of such an integral
is often not possible because the pollutant
0
2,000
4,000
6,000
8,000
1990
1991
1992
1993
1994
1995
1996
1997
1998
1999
2000
2001
2002
2003
2004
2005
2006
2007
2008
NO
x emissions (1,000 tonnes)
Road: Passenger cars
Road: Light duty vehicles
Road: Heavy-duty vehicles
Road: Two-wheel vehicles
Railways
International inland waterways
National navigation (shipping)
0
50
100
150
200
250
300
350
400
450
1990
1991
1992
1993
1994
1995
1996
1997
1998
1999
2000
2001
2002
2003
2004
2005
2006
2007
2008
PM
10 emissions (1,000 tonnes)
Road: Passenger cars
Road: Light duty vehicles
Road: Heavy-duty vehicles
Road: Two-wheel vehicles
Road: tyre & brake wear
Road: road abrasion
Railways
International inland waterways
National navigation (shipping)
0
10,000
20,000
30,000
40,000
1990
1991
1992
1993
1994
1995
1996
1997
1998
1999
2000
2001
2002
2003
2004
2005
2006
2007
2008
CO emissions (1,000 tonnes)
Road: Passenger cars
Road: Light duty vehicles
Road: Heavy-duty vehicles
Road: Two-wheel vehicles
Railways
International inland waterways
National navigation (shipping)
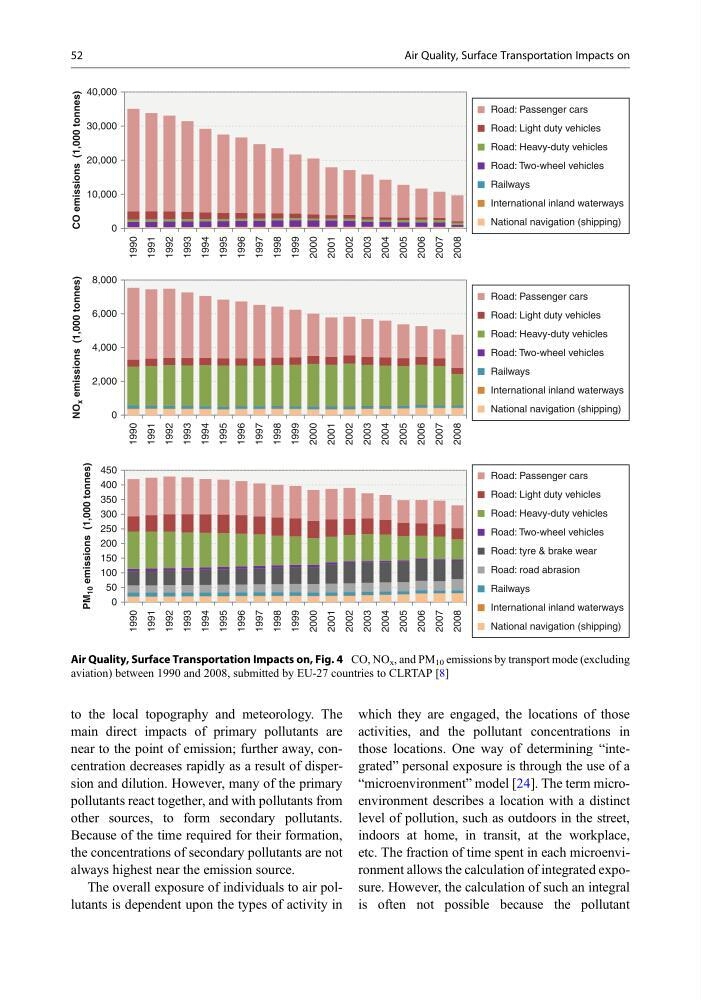
Air Quality, Surface Transportation Impacts on, Fig. 4 CO, NO x , and PM 10 emissions by transport mode (excluding
aviation) between 1990 and 2008, submitted by EU-27 countries to CLRTAP [8]
52
Air Quality, Surface Transportation Impacts on
main direct impacts of primary pollutants are
near to the point of emission; further away, concentration decreases rapidly as a result of dispersion and dilution. However, many of the primary
pollutants react together, and with pollutants from
other sources, to form secondary pollutants.
Because of the time required for their formation,
the concentrations of secondary pollutants are not
always highest near the emission source.
The overall exposure of individuals to air pollutants is dependent upon the types of activity in
which they are engaged, the locations of those
activities, and the pollutant concentrations in
those locations. One way of determining “integrated” personal exposure is through the use of a
“microenvironment” model [24]. The term microenvironment describes a location with a distinct
level of pollution, such as outdoors in the street,
indoors at home, in transit, at the workplace,
etc. The fraction of time spent in each microenvironment allows the calculation of integrated exposure. However, the calculation of such an integral
is often not possible because the pollutant
0
2,000
4,000
6,000
8,000
1990
1991
1992
1993
1994
1995
1996
1997
1998
1999
2000
2001
2002
2003
2004
2005
2006
2007
2008
NO
x emissions (1,000 tonnes)
Road: Passenger cars
Road: Light duty vehicles
Road: Heavy-duty vehicles
Road: Two-wheel vehicles
Railways
International inland waterways
National navigation (shipping)
0
50
100
150
200
250
300
350
400
450
1990
1991
1992
1993
1994
1995
1996
1997
1998
1999
2000
2001
2002
2003
2004
2005
2006
2007
2008
PM
10 emissions (1,000 tonnes)
Road: Passenger cars
Road: Light duty vehicles
Road: Heavy-duty vehicles
Road: Two-wheel vehicles
Road: tyre & brake wear
Road: road abrasion
Railways
International inland waterways
National navigation (shipping)
0
10,000
20,000
30,000
40,000
1990
1991
1992
1993
1994
1995
1996
1997
1998
1999
2000
2001
2002
2003
2004
2005
2006
2007
2008
CO emissions (1,000 tonnes)
Road: Passenger cars
Road: Light duty vehicles
Road: Heavy-duty vehicles
Road: Two-wheel vehicles
Railways
International inland waterways
National navigation (shipping)
Air Quality, Surface Transportation Impacts on, Fig. 4 CO, NO x , and PM 10 emissions by transport mode (excluding
aviation) between 1990 and 2008, submitted by EU-27 countries to CLRTAP [8]
52
Air Quality, Surface Transportation Impacts on