

David Allan. The method was initially a variance
analysis method for the study of the stability of
oscillators and atomic clocks; however, due to
their functional similarity to sensors, the method
has been adapted to characterize random drift for a
variety of devices [40]. The Allan Variance presents the root mean square (RMS) random drift
error as a function of averaging time [40], which
means it helps to identify error sources and their
contribution to the overall noise statistics in sensor data. There are five basic noise terms, which
are angle random walk, rate random walk, drift
rate ramp, bias instability, and quantization noise,
see Fig. 3 [44]. Mathematically, the Allan variance is defined as [43]
s
2
O t
ð Þ ¼
1
2
O kþ1 À O k
ð
Þ
2 ¼
1
2
O kþ1 À O k
À
Á 2
D
E
which is related to the power spectral density
(PSD) of the intrinsic random processes, S O (f),
by [43]
s
2
O t
ð Þ ¼ 4
Z 1
0
S O f
ð Þ
sin
4
pf t
ð Þ
pf t
ð Þ
2
df
Since PSD amplitudes depend on the resolution bandwidth, a function of sampling rate, the
sampling rate affects the Allan variance results.
A typical theoretical Allan variance plot is shown
in Fig. 3. Quantization noise is the most important
source of variance over short time scales and drift
is most important at long time scales, etc.
To check the data sampling rate effect, different rate data sets should be collected for the system. It is also important to be aware of potential
cross-sensitive compounds when interpreting
data. Cross-sensitivity is when the sensor
responds to gases other than the target gas
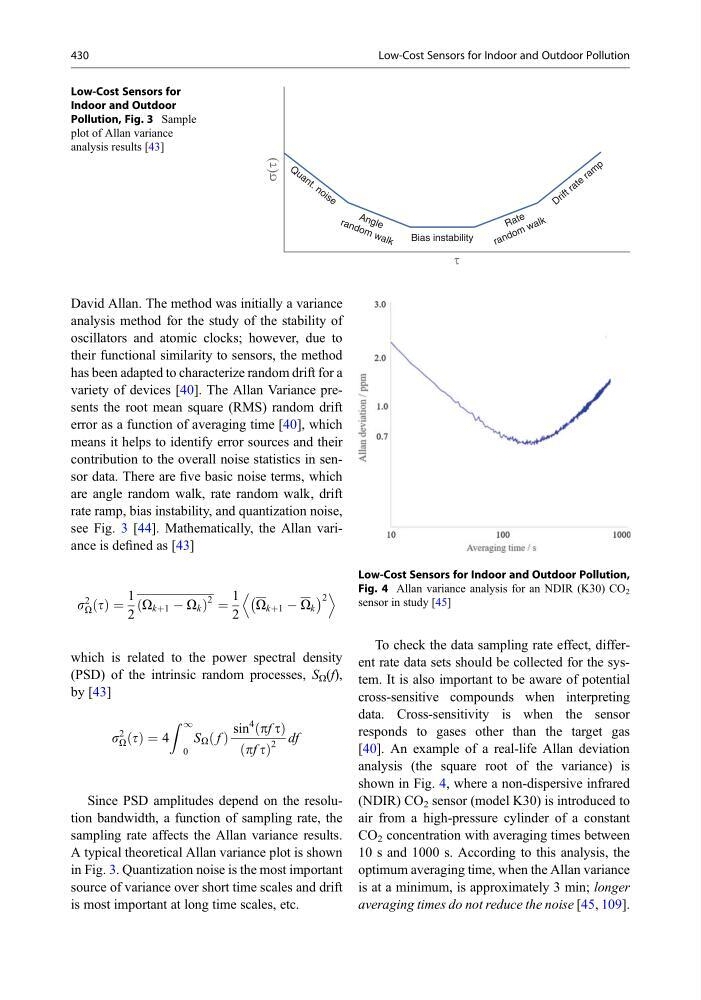
[40]. An example of a real-life Allan deviation
analysis (the square root of the variance) is
shown in Fig. 4, where a non-dispersive infrared
(NDIR) CO 2 sensor (model K30) is introduced to
air from a high-pressure cylinder of a constant
CO 2 concentration with averaging times between
10 s and 1000 s. According to this analysis, the
optimum averaging time, when the Allan variance
is at a minimum, is approximately 3 min; longer
averaging times do not reduce the noise [45, 109].
Q u a n t . n o is e
D r i f t r a t e
r a m
p
A n g le
ra n d o m w a lk
R a te
ra n d o m w a lk
Bias instability
τ
σ(τ)
Low-Cost Sensors for
Indoor and Outdoor
Pollution, Fig. 3 Sample
plot of Allan variance
analysis results [43]
Low-Cost Sensors for Indoor and Outdoor Pollution,
Fig. 4 Allan variance analysis for an NDIR (K30) CO 2
sensor in study [45]
430
Low-Cost Sensors for Indoor and Outdoor Pollution
analysis method for the study of the stability of
oscillators and atomic clocks; however, due to
their functional similarity to sensors, the method
has been adapted to characterize random drift for a
variety of devices [40]. The Allan Variance presents the root mean square (RMS) random drift
error as a function of averaging time [40], which
means it helps to identify error sources and their
contribution to the overall noise statistics in sensor data. There are five basic noise terms, which
are angle random walk, rate random walk, drift
rate ramp, bias instability, and quantization noise,
see Fig. 3 [44]. Mathematically, the Allan variance is defined as [43]
s
2
O t
ð Þ ¼
1
2
O kþ1 À O k
ð
Þ
2 ¼
1
2
O kþ1 À O k
À
Á 2
D
E
which is related to the power spectral density
(PSD) of the intrinsic random processes, S O (f),
by [43]
s
2
O t
ð Þ ¼ 4
Z 1
0
S O f
ð Þ
sin
4
pf t
ð Þ
pf t
ð Þ
2
df
Since PSD amplitudes depend on the resolution bandwidth, a function of sampling rate, the
sampling rate affects the Allan variance results.
A typical theoretical Allan variance plot is shown
in Fig. 3. Quantization noise is the most important
source of variance over short time scales and drift
is most important at long time scales, etc.
To check the data sampling rate effect, different rate data sets should be collected for the system. It is also important to be aware of potential
cross-sensitive compounds when interpreting
data. Cross-sensitivity is when the sensor
responds to gases other than the target gas
[40]. An example of a real-life Allan deviation
analysis (the square root of the variance) is
shown in Fig. 4, where a non-dispersive infrared
(NDIR) CO 2 sensor (model K30) is introduced to
air from a high-pressure cylinder of a constant
CO 2 concentration with averaging times between
10 s and 1000 s. According to this analysis, the
optimum averaging time, when the Allan variance
is at a minimum, is approximately 3 min; longer
averaging times do not reduce the noise [45, 109].
Q u a n t . n o is e
D r i f t r a t e
r a m
p
A n g le
ra n d o m w a lk
R a te
ra n d o m w a lk
Bias instability
τ
σ(τ)
Low-Cost Sensors for
Indoor and Outdoor
Pollution, Fig. 3 Sample
plot of Allan variance
analysis results [43]
Low-Cost Sensors for Indoor and Outdoor Pollution,
Fig. 4 Allan variance analysis for an NDIR (K30) CO 2
sensor in study [45]
430
Low-Cost Sensors for Indoor and Outdoor Pollution