

It is important to recognize that the NAAQS
process in the United States started as an informal
rulemaking process [7, 41, 52]. The DC Court of
Appeals found that the informal process was not
sufficiently well documented with regard to the
four key elements (indicator, averaging time, concentration, and statistical form) that the Court
could perform a judicial review of the rules that
were promulgated. This resulted in a judicial decision to overturn the secondary SO 2 NAAQS in
1973 [10]. This in turn led the US Environmental
Protection Agency to develop more rigorous procedures including formal documentation [52].
Bachmann [7] summarized the adoption of
these procedures in the late 1970s noting the following points: “(1) EPA was to make available to
the public the information and technical methodologies it relied upon by the time of proposal;
(2) the preambles to proposal and final rules
were to provide a detailed explanation of EPA’s
decision; (3) EPA was required to respond to all
“significant” comments on the proposal by the
time it issues its final rule; and (4) all of the
above documents, analyses, preambles, and
responses constituted the record that the court
would examine in reviewing the final standard
decision. Objections not raised in the record
could not be raised in court. The halcyon days of
a speedy NAAQS process were over.” I agree that
the speed of the process was reduced, however,
I would add that transparency of the process was
also substantially improved. Congress apparently
agreed and these provisions were substantially
codified by the CAA Amendments of 1977 [16].
EPA’s implementation of the CAA, especially
its setting of NAAQS even with improved documentation, has been a matter of continuing controversy and litigation. Some persons might note
that controversy and litigation were enhanced by
improved documentation. Bachmann [7] summarizes many of the key legal cases in his review. In
this entry, I will only highlight several key legal
cases. The 1997 revisions of the Ozone NAAQS
[65] and Particulate Matter NAAQS [66] proved
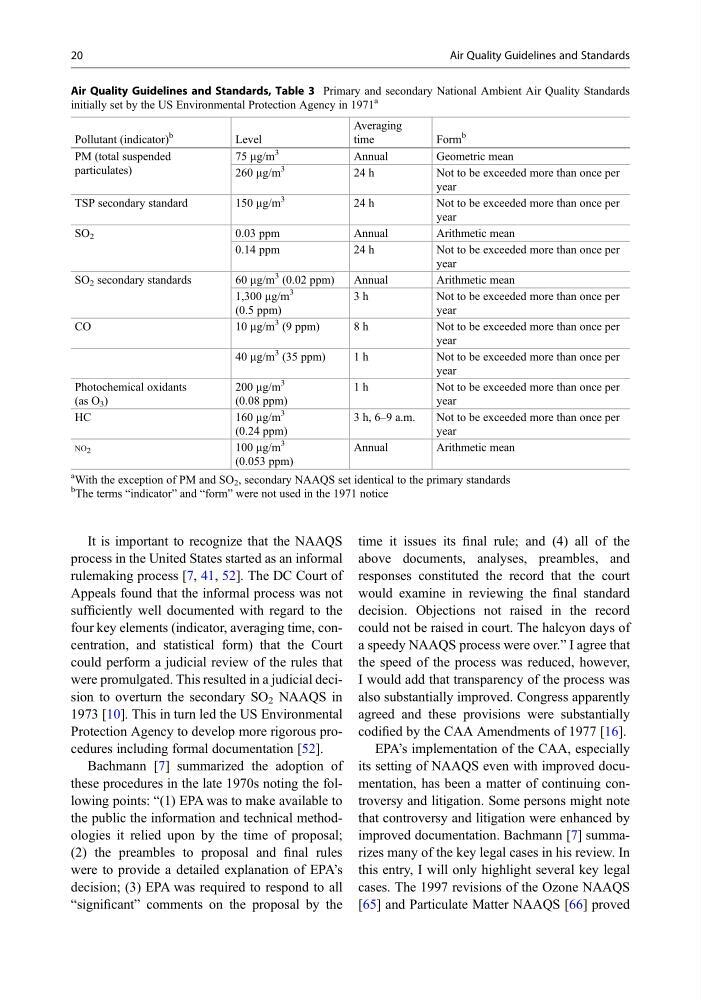
Air Quality Guidelines and Standards, Table 3 Primary and secondary National Ambient Air Quality Standards
initially set by the US Environmental Protection Agency in 1971
a
Pollutant (indicator)
b
Level
Averaging
time
Form
b
PM (total suspended
particulates)
75 mg/m
3
Annual
Geometric mean
260 mg/m
3
24 h
Not to be exceeded more than once per
year
TSP secondary standard
150 mg/m
3
24 h
Not to be exceeded more than once per
year
SO 2
0.03 ppm
Annual
Arithmetic mean
0.14 ppm
24 h
Not to be exceeded more than once per
year
SO 2 secondary standards
60 mg/m
3 (0.02 ppm)
Annual
Arithmetic mean
1,300 mg/m
3
(0.5 ppm)
3 h
Not to be exceeded more than once per
year
CO
10 mg/m
3 (9 ppm)
8 h
Not to be exceeded more than once per
year
40 mg/m
3 (35 ppm)
1 h
Not to be exceeded more than once per
year
Photochemical oxidants
(as O 3 )
200 mg/m
3
(0.08 ppm)
1 h
Not to be exceeded more than once per
year
HC
160 mg/m
3
(0.24 ppm)
3 h, 6–9 a.m.
Not to be exceeded more than once per
year
NO 2
100 mg/m
3
(0.053 ppm)
Annual
Arithmetic mean
a With the exception of PM and SO 2 , secondary NAAQS set identical to the primary standards
b
The terms “indicator” and “form” were not used in the 1971 notice
20
Air Quality Guidelines and Standards
process in the United States started as an informal
rulemaking process [7, 41, 52]. The DC Court of
Appeals found that the informal process was not
sufficiently well documented with regard to the
four key elements (indicator, averaging time, concentration, and statistical form) that the Court
could perform a judicial review of the rules that
were promulgated. This resulted in a judicial decision to overturn the secondary SO 2 NAAQS in
1973 [10]. This in turn led the US Environmental
Protection Agency to develop more rigorous procedures including formal documentation [52].
Bachmann [7] summarized the adoption of
these procedures in the late 1970s noting the following points: “(1) EPA was to make available to
the public the information and technical methodologies it relied upon by the time of proposal;
(2) the preambles to proposal and final rules
were to provide a detailed explanation of EPA’s
decision; (3) EPA was required to respond to all
“significant” comments on the proposal by the
time it issues its final rule; and (4) all of the
above documents, analyses, preambles, and
responses constituted the record that the court
would examine in reviewing the final standard
decision. Objections not raised in the record
could not be raised in court. The halcyon days of
a speedy NAAQS process were over.” I agree that
the speed of the process was reduced, however,
I would add that transparency of the process was
also substantially improved. Congress apparently
agreed and these provisions were substantially
codified by the CAA Amendments of 1977 [16].
EPA’s implementation of the CAA, especially
its setting of NAAQS even with improved documentation, has been a matter of continuing controversy and litigation. Some persons might note
that controversy and litigation were enhanced by
improved documentation. Bachmann [7] summarizes many of the key legal cases in his review. In
this entry, I will only highlight several key legal
cases. The 1997 revisions of the Ozone NAAQS
[65] and Particulate Matter NAAQS [66] proved
Air Quality Guidelines and Standards, Table 3 Primary and secondary National Ambient Air Quality Standards
initially set by the US Environmental Protection Agency in 1971
a
Pollutant (indicator)
b
Level
Averaging
time
Form
b
PM (total suspended
particulates)
75 mg/m
3
Annual
Geometric mean
260 mg/m
3
24 h
Not to be exceeded more than once per
year
TSP secondary standard
150 mg/m
3
24 h
Not to be exceeded more than once per
year
SO 2
0.03 ppm
Annual
Arithmetic mean
0.14 ppm
24 h
Not to be exceeded more than once per
year
SO 2 secondary standards
60 mg/m
3 (0.02 ppm)
Annual
Arithmetic mean
1,300 mg/m
3
(0.5 ppm)
3 h
Not to be exceeded more than once per
year
CO
10 mg/m
3 (9 ppm)
8 h
Not to be exceeded more than once per
year
40 mg/m
3 (35 ppm)
1 h
Not to be exceeded more than once per
year
Photochemical oxidants
(as O 3 )
200 mg/m
3
(0.08 ppm)
1 h
Not to be exceeded more than once per
year
HC
160 mg/m
3
(0.24 ppm)
3 h, 6–9 a.m.
Not to be exceeded more than once per
year
NO 2
100 mg/m
3
(0.053 ppm)
Annual
Arithmetic mean
a With the exception of PM and SO 2 , secondary NAAQS set identical to the primary standards
b
The terms “indicator” and “form” were not used in the 1971 notice
20
Air Quality Guidelines and Standards