

North Africa and Asia. These plumes of high
aerosol burdens extend out into ocean regions
(e.g., the African plume is seen to extend out
west into the Atlantic). North America and Europe
exhibit moderate levels of aerosol burden, while
somewhat higher burdens are seen over South
America and Australia. Significant burdens are
also seen over remote oceanic regions such as
the south Pacific and Indian Ocean. The dominant
source regions for different species are revealed
when burden distribution maps are examined for
individual aerosol species. For black carbon, the
global burden is 0.36 mg m
À2 , with values
exceeding 5 mg m
À2 occurring over China and
burdens of 1–2 mg m
À2 occurring over regions
such as Africa and South America, with slightly
lower burdens occurring over Europe and North
America. Significant black carbon plumes are
seen to advect out over the Atlantic and Indian
Oceans from the two aforementioned highest burden regions.
For dust, the global average burden is
~25 mg m
À2 , with peak burdens exceeding
500 mg m
À2 occurring over the Sahara desert in
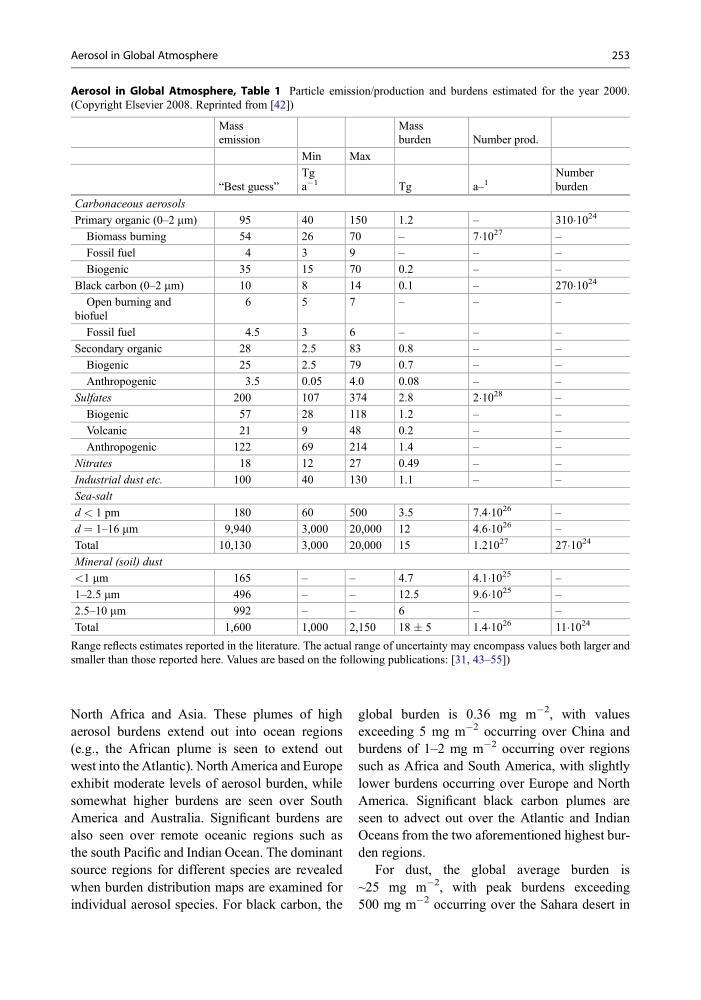
Aerosol in Global Atmosphere, Table 1 Particle emission/production and burdens estimated for the year 2000.
(Copyright Elsevier 2008. Reprinted from [42])
Mass
emission
Mass
burden
Number prod.
Min
Max
“Best guess”
Tg
a
À1
Tg
a–
1
Number
burden
Carbonaceous aerosols
Primary organic (0–2 mm)
95
40
150
1.2
–
310Á10
24
Biomass burning
54
26
70
–
7Á10
27
–
Fossil fuel
4
3
9
–
–
–
Biogenic
35
15
70
0.2
–
–
Black carbon (0–2 mm)
10
8
14
0.1
–
270Á10
24
Open burning and
biofuel
6
5
7
–
–
–
Fossil fuel
4.5
3
6
–
–
–
Secondary organic
28
2.5
83
0.8
–
–
Biogenic
25
2.5
79
0.7
–
–
Anthropogenic
3.5
0.05
4.0
0.08
–
–
Sulfates
200
107
374
2.8
2Á10
28
–
Biogenic
57
28
118
1.2
–
–
Volcanic
21
9
48
0.2
–
–
Anthropogenic
122
69
214
1.4
–
–
Nitrates
18
12
27
0.49
–
–
Industrial dust etc.
100
40
130
1.1
–
–
Sea-salt
d < 1 pm
180
60
500
3.5
7.4Á10
26
–
d ¼ 1–16 mm
9,940
3,000
20,000 12
4.6Á10
26
–
Total
10,130
3,000
20,000 15
1.210
27
27Á10
24
Mineral (soil) dust
<1 mm
165
–
–
4.7
4.1Á10
25
–
1–2.5 mm
496
–
–
12.5
9.6Á10
25
–
2.5–10 mm
992
–
–
6
–
–
Total
1,600
1,000
2,150
18 Æ 5
1.4Á10
26
11Á10
24
Range reflects estimates reported in the literature. The actual range of uncertainty may encompass values both larger and
smaller than those reported here. Values are based on the following publications: [31, 43–55])
Aerosol in Global Atmosphere
253
aerosol burdens extend out into ocean regions
(e.g., the African plume is seen to extend out
west into the Atlantic). North America and Europe
exhibit moderate levels of aerosol burden, while
somewhat higher burdens are seen over South
America and Australia. Significant burdens are
also seen over remote oceanic regions such as
the south Pacific and Indian Ocean. The dominant
source regions for different species are revealed
when burden distribution maps are examined for
individual aerosol species. For black carbon, the
global burden is 0.36 mg m
À2 , with values
exceeding 5 mg m
À2 occurring over China and
burdens of 1–2 mg m
À2 occurring over regions
such as Africa and South America, with slightly
lower burdens occurring over Europe and North
America. Significant black carbon plumes are
seen to advect out over the Atlantic and Indian
Oceans from the two aforementioned highest burden regions.
For dust, the global average burden is
~25 mg m
À2 , with peak burdens exceeding
500 mg m
À2 occurring over the Sahara desert in
Aerosol in Global Atmosphere, Table 1 Particle emission/production and burdens estimated for the year 2000.
(Copyright Elsevier 2008. Reprinted from [42])
Mass
emission
Mass
burden
Number prod.
Min
Max
“Best guess”
Tg
a
À1
Tg
a–
1
Number
burden
Carbonaceous aerosols
Primary organic (0–2 mm)
95
40
150
1.2
–
310Á10
24
Biomass burning
54
26
70
–
7Á10
27
–
Fossil fuel
4
3
9
–
–
–
Biogenic
35
15
70
0.2
–
–
Black carbon (0–2 mm)
10
8
14
0.1
–
270Á10
24
Open burning and
biofuel
6
5
7
–
–
–
Fossil fuel
4.5
3
6
–
–
–
Secondary organic
28
2.5
83
0.8
–
–
Biogenic
25
2.5
79
0.7
–
–
Anthropogenic
3.5
0.05
4.0
0.08
–
–
Sulfates
200
107
374
2.8
2Á10
28
–
Biogenic
57
28
118
1.2
–
–
Volcanic
21
9
48
0.2
–
–
Anthropogenic
122
69
214
1.4
–
–
Nitrates
18
12
27
0.49
–
–
Industrial dust etc.
100
40
130
1.1
–
–
Sea-salt
d < 1 pm
180
60
500
3.5
7.4Á10
26
–
d ¼ 1–16 mm
9,940
3,000
20,000 12
4.6Á10
26
–
Total
10,130
3,000
20,000 15
1.210
27
27Á10
24
Mineral (soil) dust
<1 mm
165
–
–
4.7
4.1Á10
25
–
1–2.5 mm
496
–
–
12.5
9.6Á10
25
–
2.5–10 mm
992
–
–
6
–
–
Total
1,600
1,000
2,150
18 Æ 5
1.4Á10
26
11Á10
24
Range reflects estimates reported in the literature. The actual range of uncertainty may encompass values both larger and
smaller than those reported here. Values are based on the following publications: [31, 43–55])
Aerosol in Global Atmosphere
253