

Bike Sharing as a Solution for Mobility Issues in São Paulo: Benchmarking …
677
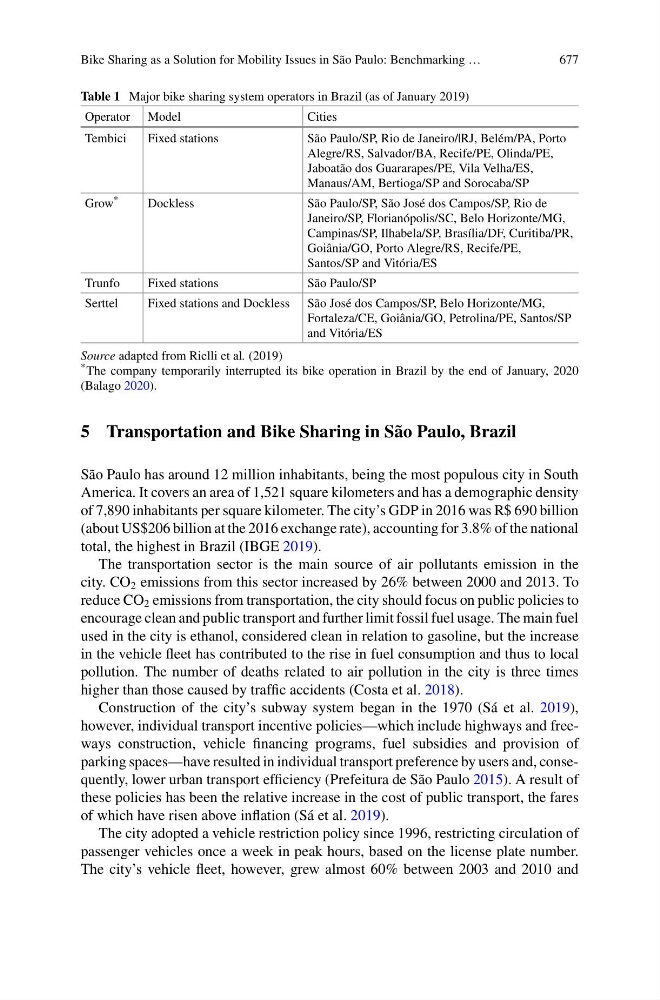
Table 1 Major bike sharing system operators in Brazil (as of January 2019)
Operator Model
Cities
Tembici
Fixed stations
São Paulo/SP, Rio de Janeiro/|RJ, Belém/PA, Porto
Alegre/RS, Salvador/BA, Recife/PE, Olinda/PE,
Jaboatão dos Guararapes/PE, Vila Velha/ES,
Manaus/AM, Bertioga/SP and Sorocaba/SP
Grow *
Dockless
São Paulo/SP, São José dos Campos/SP, Rio de
Janeiro/SP, Florianópolis/SC, Belo Horizonte/MG,
Campinas/SP, Ilhabela/SP, Brasília/DF, Curitiba/PR,
Goiânia/GO, Porto Alegre/RS, Recife/PE,
Santos/SP and Vitória/ES
Trunfo
Fixed stations
São Paulo/SP
Serttel
Fixed stations and Dockless São José dos Campos/SP, Belo Horizonte/MG,
Fortaleza/CE, Goiânia/GO, Petrolina/PE, Santos/SP
and Vitória/ES
Source adapted from Rielli et al. (2019)
* The company temporarily interrupted its bike operation in Brazil by the end of January, 2020
(Balago 2020).
5 Transportation and Bike Sharing in São Paulo, Brazil
São Paulo has around 12 million inhabitants, being the most populous city in South
America. It covers an area of 1,521 square kilometers and has a demographic density
of 7,890 inhabitants per square kilometer. The city’s GDP in 2016 was R$ 690 billion
(about US$206 billion at the 2016 exchange rate), accounting for 3.8% of the national
total, the highest in Brazil (IBGE 2019).
The transportation sector is the main source of air pollutants emission in the
city. CO 2 emissions from this sector increased by 26% between 2000 and 2013. To
reduce CO 2 emissions from transportation, the city should focus on public policies to
encourage clean and public transport and further limit fossil fuel usage. The main fuel
used in the city is ethanol, considered clean in relation to gasoline, but the increase
in the vehicle fleet has contributed to the rise in fuel consumption and thus to local
pollution. The number of deaths related to air pollution in the city is three times
higher than those caused by traffic accidents (Costa et al. 2018).
Construction of the city’s subway system began in the 1970 (Sá et al. 2019),
however, individual transport incentive policies—which include highways and freeways construction, vehicle financing programs, fuel subsidies and provision of
parking spaces—have resulted in individual transport preference by users and, consequently, lower urban transport efficiency (Prefeitura de São Paulo 2015). A result of
these policies has been the relative increase in the cost of public transport, the fares
of which have risen above inflation (Sá et al. 2019).
The city adopted a vehicle restriction policy since 1996, restricting circulation of
passenger vehicles once a week in peak hours, based on the license plate number.
The city’s vehicle fleet, however, grew almost 60% between 2003 and 2010 and