

Use of GIS to Estimate Socioeconomic Losses Caused by Urban Floods: A Tool …
653
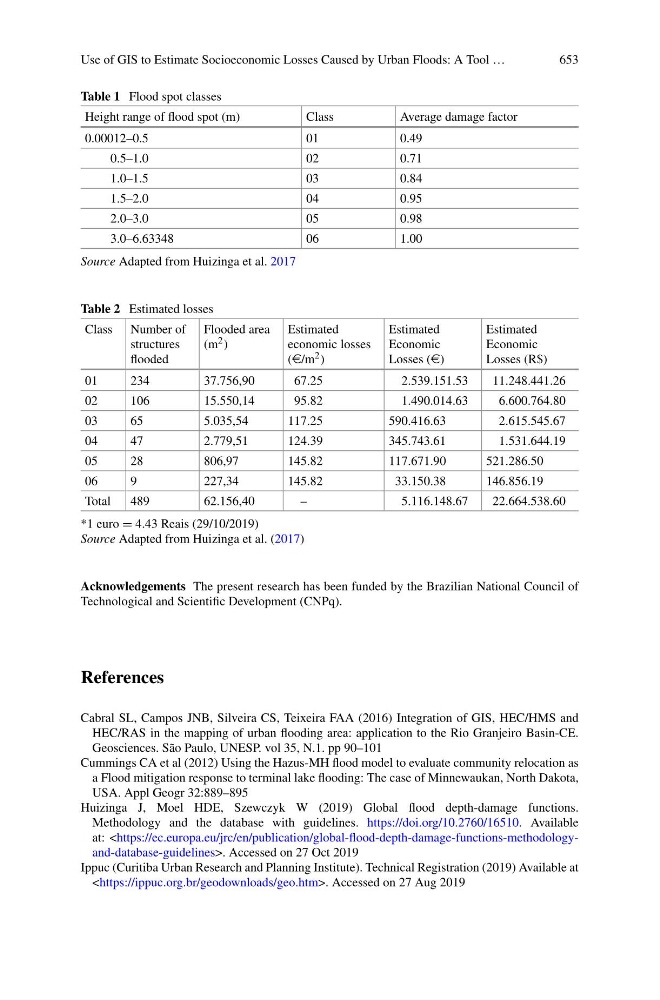
Table 1 Flood spot classes
Height range of flood spot (m)
Class
Average damage factor
0.00012–0.5
01
0.49
0.5–1.0
02
0.71
1.0–1.5
03
0.84
1.5–2.0
04
0.95
2.0–3.0
05
0.98
3.0–6.63348
06
1.00
Source Adapted from Huizinga et al. 2017
Table 2 Estimated losses
Class Number of
structures
flooded
Flooded area
(m 2 )
Estimated
economic losses
(e/m 2 )
Estimated
Economic
Losses (e)
Estimated
Economic
Losses (R$)
01
234
37.756,90
67.25
2.539.151.53
11.248.441.26
02
106
15.550,14
95.82
1.490.014.63
6.600.764.80
03
65
5.035,54
117.25
590.416.63
2.615.545.67
04
47
2.779,51
124.39
345.743.61
1.531.644.19
05
28
806,97
145.82
117.671.90
521.286.50
06
9
227,34
145.82
33.150.38
146.856.19
Total
489
62.156,40
–
5.116.148.67
22.664.538.60
*1 euro = 4.43 Reais (29/10/2019)
Source Adapted from Huizinga et al. (2017)
Acknowledgements The present research has been funded by the Brazilian National Council of
Technological and Scientific Development (CNPq).
References
Cabral SL, Campos JNB, Silveira CS, Teixeira FAA (2016) Integration of GIS, HEC/HMS and
HEC/RAS in the mapping of urban flooding area: application to the Rio Granjeiro Basin-CE.
Geosciences. São Paulo, UNESP. vol 35, N.1. pp 90–101
Cummings CA et al (2012) Using the Hazus-MH flood model to evaluate community relocation as
a Flood mitigation response to terminal lake flooding: The case of Minnewaukan, North Dakota,
USA. Appl Geogr 32:889–895
Huizinga J, Moel HDE, Szewczyk W (2019) Global flood depth-damage functions.
Methodology and the database with guidelines. https://doi.org/10.2760/16510. Available
at:. Accessed on 27 Oct 2019
Ippuc (Curitiba Urban Research and Planning Institute). Technical Registration (2019) Available at
. Accessed on 27 Aug 2019
653
Table 1 Flood spot classes
Height range of flood spot (m)
Class
Average damage factor
0.00012–0.5
01
0.49
0.5–1.0
02
0.71
1.0–1.5
03
0.84
1.5–2.0
04
0.95
2.0–3.0
05
0.98
3.0–6.63348
06
1.00
Source Adapted from Huizinga et al. 2017
Table 2 Estimated losses
Class Number of
structures
flooded
Flooded area
(m 2 )
Estimated
economic losses
(e/m 2 )
Estimated
Economic
Losses (e)
Estimated
Economic
Losses (R$)
01
234
37.756,90
67.25
2.539.151.53
11.248.441.26
02
106
15.550,14
95.82
1.490.014.63
6.600.764.80
03
65
5.035,54
117.25
590.416.63
2.615.545.67
04
47
2.779,51
124.39
345.743.61
1.531.644.19
05
28
806,97
145.82
117.671.90
521.286.50
06
9
227,34
145.82
33.150.38
146.856.19
Total
489
62.156,40
–
5.116.148.67
22.664.538.60
*1 euro = 4.43 Reais (29/10/2019)
Source Adapted from Huizinga et al. (2017)
Acknowledgements The present research has been funded by the Brazilian National Council of
Technological and Scientific Development (CNPq).
References
Cabral SL, Campos JNB, Silveira CS, Teixeira FAA (2016) Integration of GIS, HEC/HMS and
HEC/RAS in the mapping of urban flooding area: application to the Rio Granjeiro Basin-CE.
Geosciences. São Paulo, UNESP. vol 35, N.1. pp 90–101
Cummings CA et al (2012) Using the Hazus-MH flood model to evaluate community relocation as
a Flood mitigation response to terminal lake flooding: The case of Minnewaukan, North Dakota,
USA. Appl Geogr 32:889–895
Huizinga J, Moel HDE, Szewczyk W (2019) Global flood depth-damage functions.
Methodology and the database with guidelines. https://doi.org/10.2760/16510. Available
at:
Ippuc (Curitiba Urban Research and Planning Institute). Technical Registration (2019) Available at