

Use of GIS to Estimate Socioeconomic Losses Caused by Urban Floods: A Tool …
645
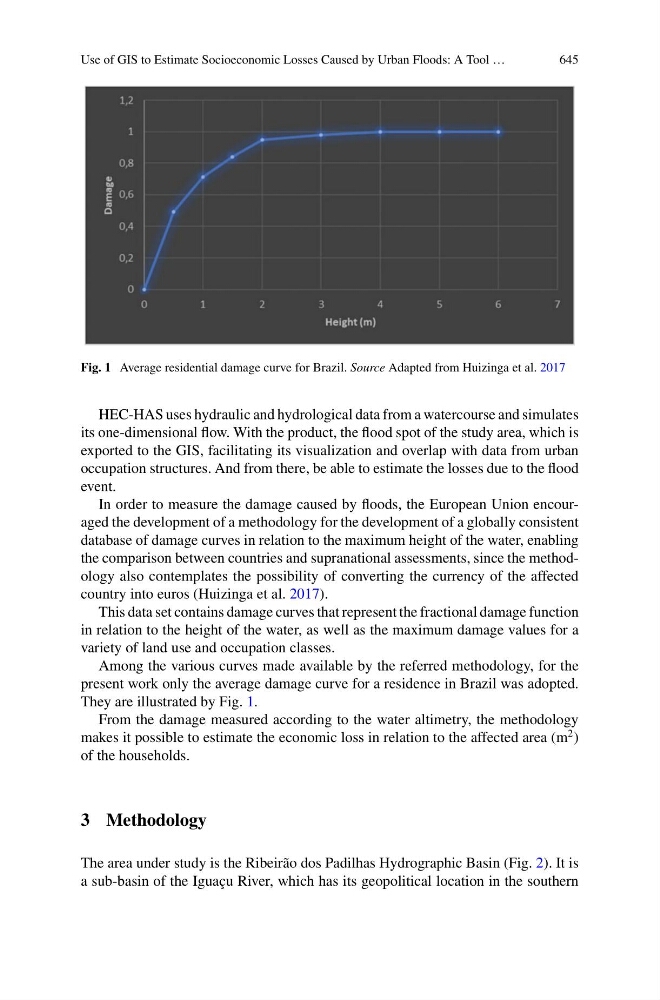
Fig. 1 Average residential damage curve for Brazil. Source Adapted from Huizinga et al. 2017
HEC-HAS uses hydraulic and hydrological data from a watercourse and simulates
its one-dimensional flow. With the product, the flood spot of the study area, which is
exported to the GIS, facilitating its visualization and overlap with data from urban
occupation structures. And from there, be able to estimate the losses due to the flood
event.
In order to measure the damage caused by floods, the European Union encouraged the development of a methodology for the development of a globally consistent
database of damage curves in relation to the maximum height of the water, enabling
the comparison between countries and supranational assessments, since the methodology also contemplates the possibility of converting the currency of the affected
country into euros (Huizinga et al. 2017).
This data set contains damage curves that represent the fractional damage function
in relation to the height of the water, as well as the maximum damage values for a
variety of land use and occupation classes.
Among the various curves made available by the referred methodology, for the
present work only the average damage curve for a residence in Brazil was adopted.
They are illustrated by Fig. 1.
From the damage measured according to the water altimetry, the methodology
makes it possible to estimate the economic loss in relation to the affected area (m
2 )
of the households.
3 Methodology
The area under study is the Ribeirão dos Padilhas Hydrographic Basin (Fig. 2). It is
a sub-basin of the Iguaçu River, which has its geopolitical location in the southern