

288
M. L. M. Bernartt et al.
Table 4 Waste and tailings
estimation
Description
kg
Quantity os waste per year
575,205.00
Quantity os waste per month
47,933.75
Quantity of tailing per month
16,297.48
from the total waste that is routed daily for screening, approximately 66% is sold as
recyclable and 34% is considered tailings and are sent to landfill.
From data received by SMMA Campo Largo from 2017, the monthly and daily
average of waste received per day was estimated, as well as the quantity of tailings
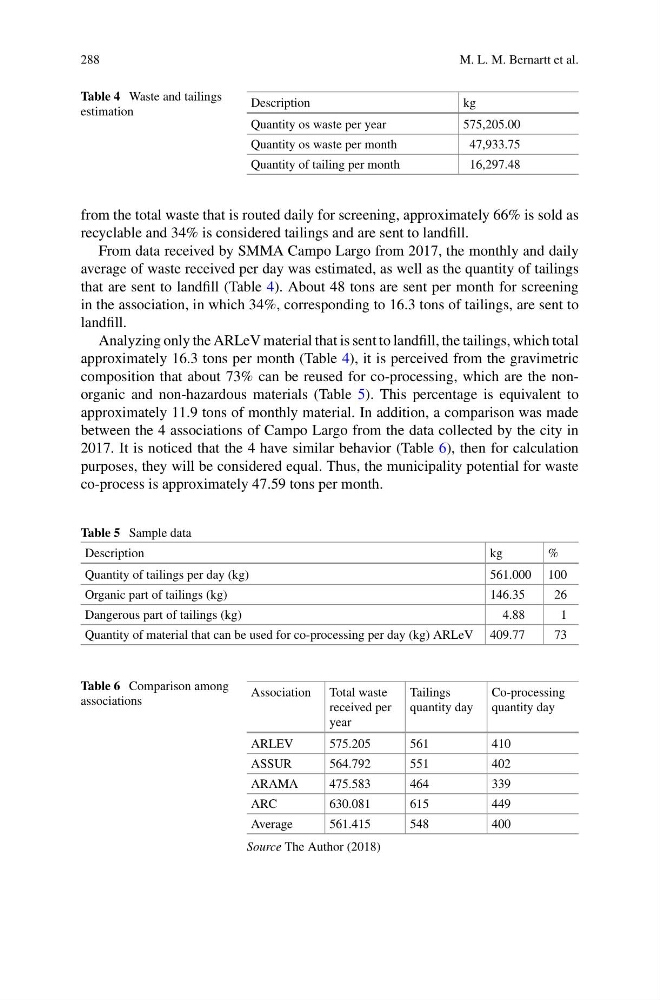
that are sent to landfill (Table 4). About 48 tons are sent per month for screening
in the association, in which 34%, corresponding to 16.3 tons of tailings, are sent to
landfill.
Analyzing only the ARLeV material that is sent to landfill, the tailings, which total
approximately 16.3 tons per month (Table 4), it is perceived from the gravimetric
composition that about 73% can be reused for co-processing, which are the nonorganic and non-hazardous materials (Table 5). This percentage is equivalent to
approximately 11.9 tons of monthly material. In addition, a comparison was made
between the 4 associations of Campo Largo from the data collected by the city in
2017. It is noticed that the 4 have similar behavior (Table 6), then for calculation
purposes, they will be considered equal. Thus, the municipality potential for waste
co-process is approximately 47.59 tons per month.
Table 5 Sample data
Description
kg
%
Quantity of tailings per day (kg)
561.000 100
Organic part of tailings (kg)
146.35
26
Dangerous part of tailings (kg)
4.88
1
Quantity of material that can be used for co-processing per day (kg) ARLeV 409.77
73
Table 6 Comparison among
associations
Association Total waste
received per
year
Tailings
quantity day
Co-processing
quantity day
ARLEV
575.205
561
410
ASSUR
564.792
551
402
ARAMA
475.583
464
339
ARC
630.081
615
449
Average
561.415
548
400
Source The Author (2018)
M. L. M. Bernartt et al.
Table 4 Waste and tailings
estimation
Description
kg
Quantity os waste per year
575,205.00
Quantity os waste per month
47,933.75
Quantity of tailing per month
16,297.48
from the total waste that is routed daily for screening, approximately 66% is sold as
recyclable and 34% is considered tailings and are sent to landfill.
From data received by SMMA Campo Largo from 2017, the monthly and daily
average of waste received per day was estimated, as well as the quantity of tailings
that are sent to landfill (Table 4). About 48 tons are sent per month for screening
in the association, in which 34%, corresponding to 16.3 tons of tailings, are sent to
landfill.
Analyzing only the ARLeV material that is sent to landfill, the tailings, which total
approximately 16.3 tons per month (Table 4), it is perceived from the gravimetric
composition that about 73% can be reused for co-processing, which are the nonorganic and non-hazardous materials (Table 5). This percentage is equivalent to
approximately 11.9 tons of monthly material. In addition, a comparison was made
between the 4 associations of Campo Largo from the data collected by the city in
2017. It is noticed that the 4 have similar behavior (Table 6), then for calculation
purposes, they will be considered equal. Thus, the municipality potential for waste
co-process is approximately 47.59 tons per month.
Table 5 Sample data
Description
kg
%
Quantity of tailings per day (kg)
561.000 100
Organic part of tailings (kg)
146.35
26
Dangerous part of tailings (kg)
4.88
1
Quantity of material that can be used for co-processing per day (kg) ARLeV 409.77
73
Table 6 Comparison among
associations
Association Total waste
received per
year
Tailings
quantity day
Co-processing
quantity day
ARLEV
575.205
561
410
ASSUR
564.792
551
402
ARAMA
475.583
464
339
ARC
630.081
615
449
Average
561.415
548
400
Source The Author (2018)