

216
A. Mallqui et al.
(Cho et al. 2012; Laufer 2003; Milne and Gray 2007) and the threat to subjectively
translate qualitative data into quantitative results (Deegan and Rankin 1996; Guthrie
and Abeysekera 2006). However, sustainability reports are said to be representative
of the corporate attitude towards sustainability (Ihlen and Roper 2014).
The seven cases are chosen considering the mining operations found in the countries with the greatest representation in Latin America. We consider Chile to be the
main copper producer, Brazil the second iron producer, Mexico the largest silver
producer, Peru that is among the first silver, copper, gold and lead producers and
Argentina that together with Chile has the largest lithium reserves (U.S. Geological
Survey 2019).
Another point to consider when choosing mining companies was that the sustainability report of the last year (2018) be published and that the scope of the report
only covers mining operations in Latin America.
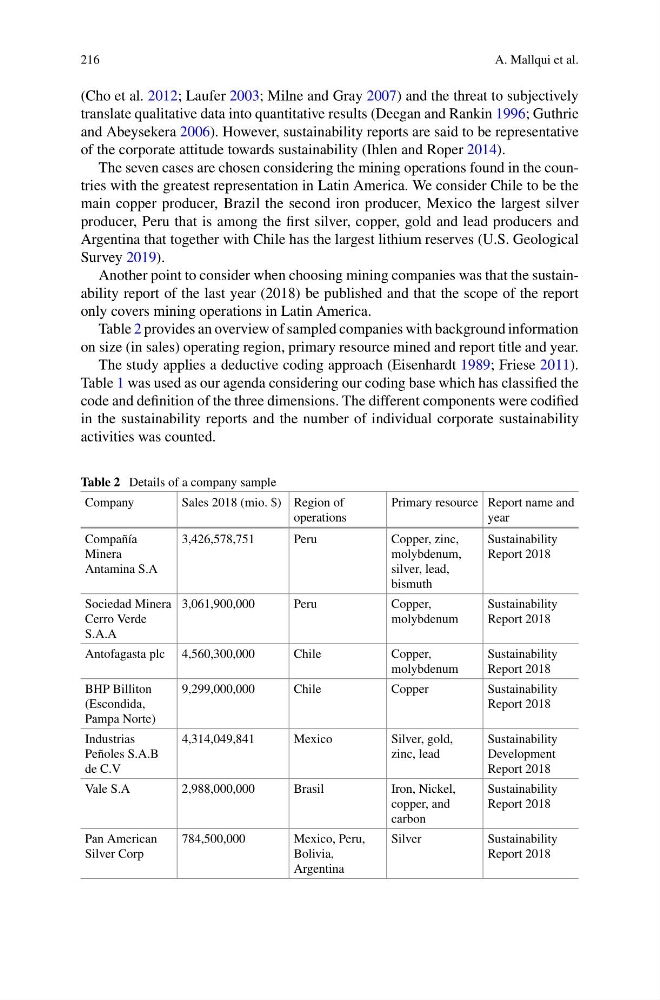
Table 2 provides an overview of sampled companies with background information
on size (in sales) operating region, primary resource mined and report title and year.
The study applies a deductive coding approach (Eisenhardt 1989; Friese 2011).
Table 1 was used as our agenda considering our coding base which has classified the
code and definition of the three dimensions. The different components were codified
in the sustainability reports and the number of individual corporate sustainability
activities was counted.
Table 2 Details of a company sample
Company
Sales 2018 (mio. $) Region of
operations
Primary resource Report name and
year
Compañía
Minera
Antamina S.A
3,426,578,751
Peru
Copper, zinc,
molybdenum,
silver, lead,
bismuth
Sustainability
Report 2018
Sociedad Minera
Cerro Verde
S.A.A
3,061,900,000
Peru
Copper,
molybdenum
Sustainability
Report 2018
Antofagasta plc 4,560,300,000
Chile
Copper,
molybdenum
Sustainability
Report 2018
BHP Billiton
(Escondida,
Pampa Norte)
9,299,000,000
Chile
Copper
Sustainability
Report 2018
Industrias
Peñoles S.A.B
de C.V
4,314,049,841
Mexico
Silver, gold,
zinc, lead
Sustainability
Development
Report 2018
Vale S.A
2,988,000,000
Brasil
Iron, Nickel,
copper, and
carbon
Sustainability
Report 2018
Pan American
Silver Corp
784,500,000
Mexico, Peru,
Bolivia,
Argentina
Silver
Sustainability
Report 2018
A. Mallqui et al.
(Cho et al. 2012; Laufer 2003; Milne and Gray 2007) and the threat to subjectively
translate qualitative data into quantitative results (Deegan and Rankin 1996; Guthrie
and Abeysekera 2006). However, sustainability reports are said to be representative
of the corporate attitude towards sustainability (Ihlen and Roper 2014).
The seven cases are chosen considering the mining operations found in the countries with the greatest representation in Latin America. We consider Chile to be the
main copper producer, Brazil the second iron producer, Mexico the largest silver
producer, Peru that is among the first silver, copper, gold and lead producers and
Argentina that together with Chile has the largest lithium reserves (U.S. Geological
Survey 2019).
Another point to consider when choosing mining companies was that the sustainability report of the last year (2018) be published and that the scope of the report
only covers mining operations in Latin America.
Table 2 provides an overview of sampled companies with background information
on size (in sales) operating region, primary resource mined and report title and year.
The study applies a deductive coding approach (Eisenhardt 1989; Friese 2011).
Table 1 was used as our agenda considering our coding base which has classified the
code and definition of the three dimensions. The different components were codified
in the sustainability reports and the number of individual corporate sustainability
activities was counted.
Table 2 Details of a company sample
Company
Sales 2018 (mio. $) Region of
operations
Primary resource Report name and
year
Compañía
Minera
Antamina S.A
3,426,578,751
Peru
Copper, zinc,
molybdenum,
silver, lead,
bismuth
Sustainability
Report 2018
Sociedad Minera
Cerro Verde
S.A.A
3,061,900,000
Peru
Copper,
molybdenum
Sustainability
Report 2018
Antofagasta plc 4,560,300,000
Chile
Copper,
molybdenum
Sustainability
Report 2018
BHP Billiton
(Escondida,
Pampa Norte)
9,299,000,000
Chile
Copper
Sustainability
Report 2018
Industrias
Peñoles S.A.B
de C.V
4,314,049,841
Mexico
Silver, gold,
zinc, lead
Sustainability
Development
Report 2018
Vale S.A
2,988,000,000
Brasil
Iron, Nickel,
copper, and
carbon
Sustainability
Report 2018
Pan American
Silver Corp
784,500,000
Mexico, Peru,
Bolivia,
Argentina
Silver
Sustainability
Report 2018