

196
Analytical Heat Transfer
u v
>
u'
v'
−u'
−v'
U ∞ ,T ∞
x
y
T w
u' ≅ −v'
δ L
δ
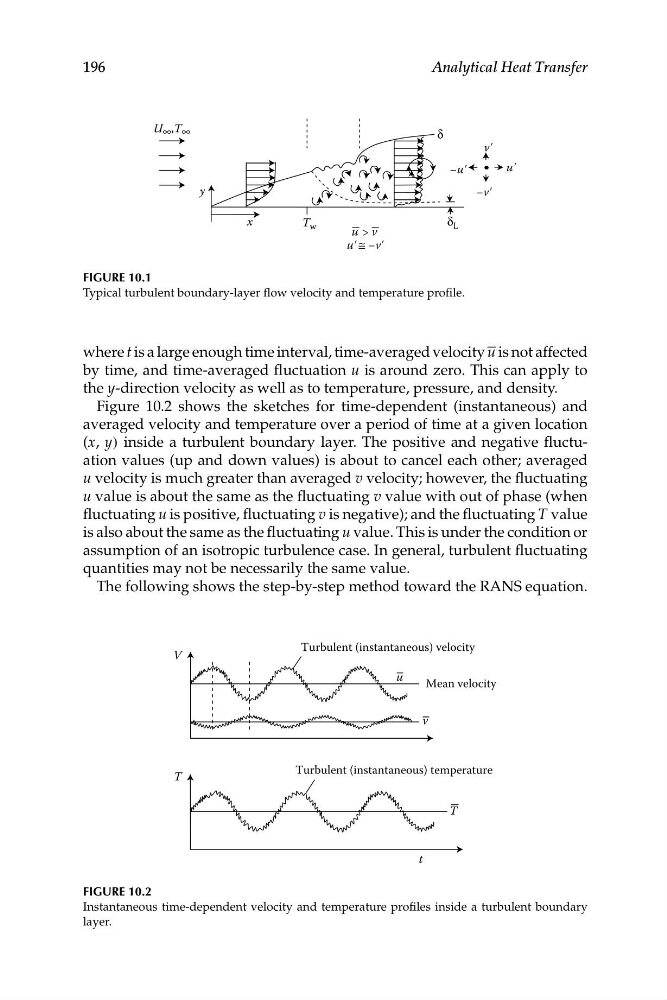
FIGURE 10.1
Typical turbulent boundary-layer flow velocity and temperature profile.
where t is a large enough time interval, time-averaged velocity u is not affected
by time, and time-averaged fluctuation u is around zero. This can apply to
the y-direction velocity as well as to temperature, pressure, and density.
Figure 10.2 shows the sketches for time-dependent (instantaneous) and
averaged velocity and temperature over a period of time at a given location
(x, y) inside a turbulent boundary layer. The positive and negative fluctuation values (up and down values) is about to cancel each other; averaged
u velocity is much greater than averaged v velocity; however, the fluctuating
u value is about the same as the fluctuating v value with out of phase (when
fluctuating u is positive, fluctuating v is negative); and the fluctuating T value
is also about the same as the fluctuating u value. This is under the condition or
assumption of an isotropic turbulence case. In general, turbulent fluctuating
quantities may not be necessarily the same value.
The following shows the step-by-step method toward the RANS equation.
Turbulent (instantaneous) velocity
V
v
u
Mean velocity
Turbulent (instantaneous) temperature
T
T
t
FIGURE 10.2
Instantaneous time-dependent velocity and temperature profiles inside a turbulent boundary
layer.
Analytical Heat Transfer
u v
>
u'
v'
−u'
−v'
U ∞ ,T ∞
x
y
T w
u' ≅ −v'
δ L
δ
FIGURE 10.1
Typical turbulent boundary-layer flow velocity and temperature profile.
where t is a large enough time interval, time-averaged velocity u is not affected
by time, and time-averaged fluctuation u is around zero. This can apply to
the y-direction velocity as well as to temperature, pressure, and density.
Figure 10.2 shows the sketches for time-dependent (instantaneous) and
averaged velocity and temperature over a period of time at a given location
(x, y) inside a turbulent boundary layer. The positive and negative fluctuation values (up and down values) is about to cancel each other; averaged
u velocity is much greater than averaged v velocity; however, the fluctuating
u value is about the same as the fluctuating v value with out of phase (when
fluctuating u is positive, fluctuating v is negative); and the fluctuating T value
is also about the same as the fluctuating u value. This is under the condition or
assumption of an isotropic turbulence case. In general, turbulent fluctuating
quantities may not be necessarily the same value.
The following shows the step-by-step method toward the RANS equation.
Turbulent (instantaneous) velocity
V
v
u
Mean velocity
Turbulent (instantaneous) temperature
T
T
t
FIGURE 10.2
Instantaneous time-dependent velocity and temperature profiles inside a turbulent boundary
layer.