

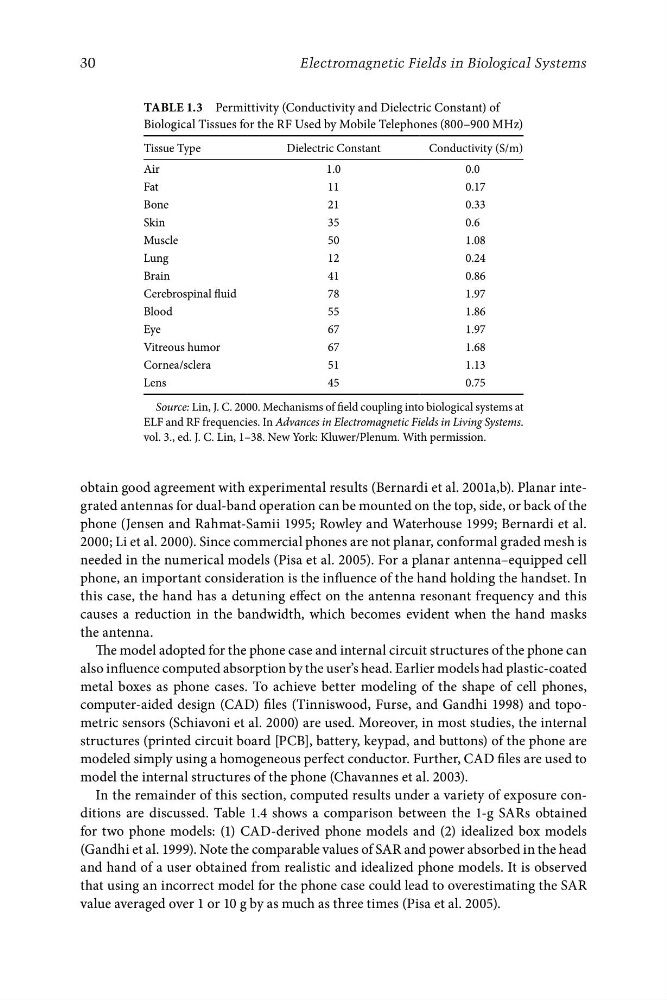
TaBlE 1.3 Permittivity (Conductivity and Dielectric Constant) of
Biological Tissues for the RF Used by Mobile Telephones (800–900 MHz)
Tissue Type
Dielectric Constant
Conductivity (S/m)
Air
1.0
0.0
Fat
11
0.17
Bone
21
0.33
Skin
35
0.6
Muscle
50
1.08
Lung
12
0.24
Brain
41
0.86
Cerebrospinal fluid
78
1.97
Blood
55
1.86
Eye
67
1.97
Vitreous humor
67
1.68
Cornea/sclera
51
1.13
Lens
45
0.75
Source: Lin, J. C. 2000. Mechanisms of field coupling into biological systems at
ELF and RF frequencies. In Advances in Electromagnetic Fields in Living Systems.
vol. 3., ed. J. C. Lin, 1–38. New York: Kluwer/Plenum. With permission.
30
Electromagnetic Fields in Biological Systems
obtain good agreement with experimental results (Bernardi et al. 2001a,b). Planar integrated antennas for dual-band operation can be mounted on the top, side, or back of the
phone (Jensen and Rahmat-Samii 1995; Rowley and Waterhouse 1999; Bernardi et al.
2000; Li et al. 2000). Since commercial phones are not planar, conformal graded mesh is
needed in the numerical models (Pisa et al. 2005). For a planar antenna–equipped cell
phone, an important consideration is the influence of the hand holding the handset. In
this case, the hand has a detuning effect on the antenna resonant frequency and this
causes a reduction in the bandwidth, which becomes evident when the hand masks
the antenna.
The model adopted for the phone case and internal circuit structures of the phone can
also influence computed absorption by the user’s head. Earlier models had plastic-coated
metal boxes as phone cases. To achieve better modeling of the shape of cell phones,
computer-aided design (CAD) files (Tinniswood, Furse, and Gandhi 1998) and topometric sensors (Schiavoni et al. 2000) are used. Moreover, in most studies, the internal
structures (printed circuit board [PCB], battery, keypad, and buttons) of the phone are
modeled simply using a homogeneous perfect conductor. Further, CAD files are used to
model the internal structures of the phone (Chavannes et al. 2003).
In the remainder of this section, computed results under a variety of exposure conditions are discussed. Table 1.4 shows a comparison between the 1-g SARs obtained
for two phone models: (1) CAD-derived phone models and (2) idealized box models
(Gandhi et al. 1999). Note the comparable values of SAR and power absorbed in the head
and hand of a user obtained from realistic and idealized phone models. It is observed
that using an incorrect model for the phone case could lead to overestimating the SAR
value averaged over 1 or 10 g by as much as three times (Pisa et al. 2005).