

15
1
x-axis
50
0.9
y-axis
100
0.8
0.7
0.6
0.5
0.4
0.3
400
0.2
450
0.1
500
0
0
100
200
300
400
500
−8 −6 −4 −2
0
2
4
6
8
Location (cm)
15
1
x-axis
50
0.9
y-axis
100
0.8
SAR/SAR max
150
10
200
250
300
5
350
150
SAR/SAR max
0.7
0.6
0.5
0.4
0.3
400
0.2
450
0.1
500
0
0
100
200
300
400
500
−8 −6 −4 −2
0
2
4
6
8
Location (cm)
15
1
x-axis
50
0.9
y-axis
100
0.8
10
200
1
250
300
5
350
SAR/SAR max
0.7
150
10
0.6
200
0.5
250
0.4
300
0.3
5
350
400
0.2
450
0.1
500
100
200
300
400
500
0
0 −8 −6 −4 −2
0
2
4
6
8
Location (cm)
23
Coupling of Electromagnetic Fields into Biological Systems
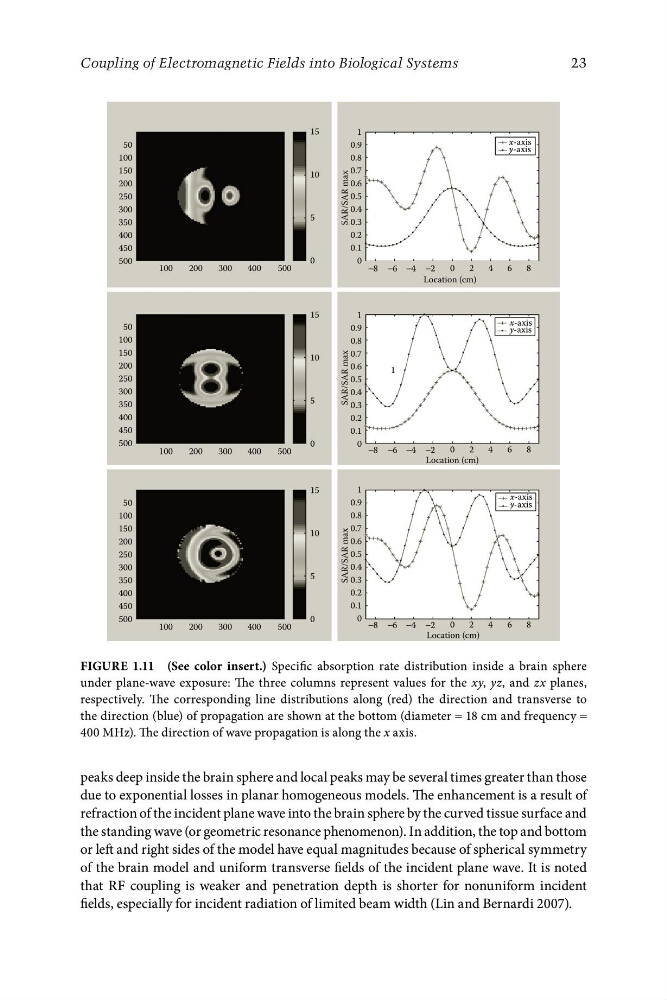
FigurE 1.11 (See color insert.) Specific absorption rate distribution inside a brain sphere
under plane-wave exposure: The three columns represent values for the xy, yz, and zx planes,
respectively. The corresponding line distributions along (red) the direction and transverse to
the direction (blue) of propagation are shown at the bottom (diameter = 18 cm and frequency =
400 MHz). The direction of wave propagation is along the x axis.
peaks deep inside the brain sphere and local peaks may be several times greater than those
due to exponential losses in planar homogeneous models. The enhancement is a result of
refraction of the incident plane wave into the brain sphere by the curved tissue surface and
the standing wave (or geometric resonance phenomenon). In addition, the top and bottom
or left and right sides of the model have equal magnitudes because of spherical symmetry
of the brain model and uniform transverse fields of the incident plane wave. It is noted
that RF coupling is weaker and penetration depth is shorter for nonuniform incident
fields, especially for incident radiation of limited beam width (Lin and Bernardi 2007).
1
x-axis
50
0.9
y-axis
100
0.8
0.7
0.6
0.5
0.4
0.3
400
0.2
450
0.1
500
0
0
100
200
300
400
500
−8 −6 −4 −2
0
2
4
6
8
Location (cm)
15
1
x-axis
50
0.9
y-axis
100
0.8
SAR/SAR max
150
10
200
250
300
5
350
150
SAR/SAR max
0.7
0.6
0.5
0.4
0.3
400
0.2
450
0.1
500
0
0
100
200
300
400
500
−8 −6 −4 −2
0
2
4
6
8
Location (cm)
15
1
x-axis
50
0.9
y-axis
100
0.8
10
200
1
250
300
5
350
SAR/SAR max
0.7
150
10
0.6
200
0.5
250
0.4
300
0.3
5
350
400
0.2
450
0.1
500
100
200
300
400
500
0
0 −8 −6 −4 −2
0
2
4
6
8
Location (cm)
23
Coupling of Electromagnetic Fields into Biological Systems
FigurE 1.11 (See color insert.) Specific absorption rate distribution inside a brain sphere
under plane-wave exposure: The three columns represent values for the xy, yz, and zx planes,
respectively. The corresponding line distributions along (red) the direction and transverse to
the direction (blue) of propagation are shown at the bottom (diameter = 18 cm and frequency =
400 MHz). The direction of wave propagation is along the x axis.
peaks deep inside the brain sphere and local peaks may be several times greater than those
due to exponential losses in planar homogeneous models. The enhancement is a result of
refraction of the incident plane wave into the brain sphere by the curved tissue surface and
the standing wave (or geometric resonance phenomenon). In addition, the top and bottom
or left and right sides of the model have equal magnitudes because of spherical symmetry
of the brain model and uniform transverse fields of the incident plane wave. It is noted
that RF coupling is weaker and penetration depth is shorter for nonuniform incident
fields, especially for incident radiation of limited beam width (Lin and Bernardi 2007).