

163
Static, Low-Frequency, and Pulsed Magnetic Fields
More recently, guidelines for limiting exposure to time-varying EMFs (1 Hz to
100 kHz) have been proposed as a safety standard by ICNIRP (2010). For example, in
the ICNIRP 2010 standard, for EMF exposures in the 1 Hz to 3 kHz range the basic
restrictions for induced internal E fields in all tissues of the head and body are 0.8 and
0.4 V/m for occupational and general public exposures, respectively. Perception of surface electric charge, direct stimulation of nerve and muscle tissues, and induction of
retinal phosphenes are the only well-established adverse effects, and serve as the basis
for exposure guidelines (ICNIRP 2010).
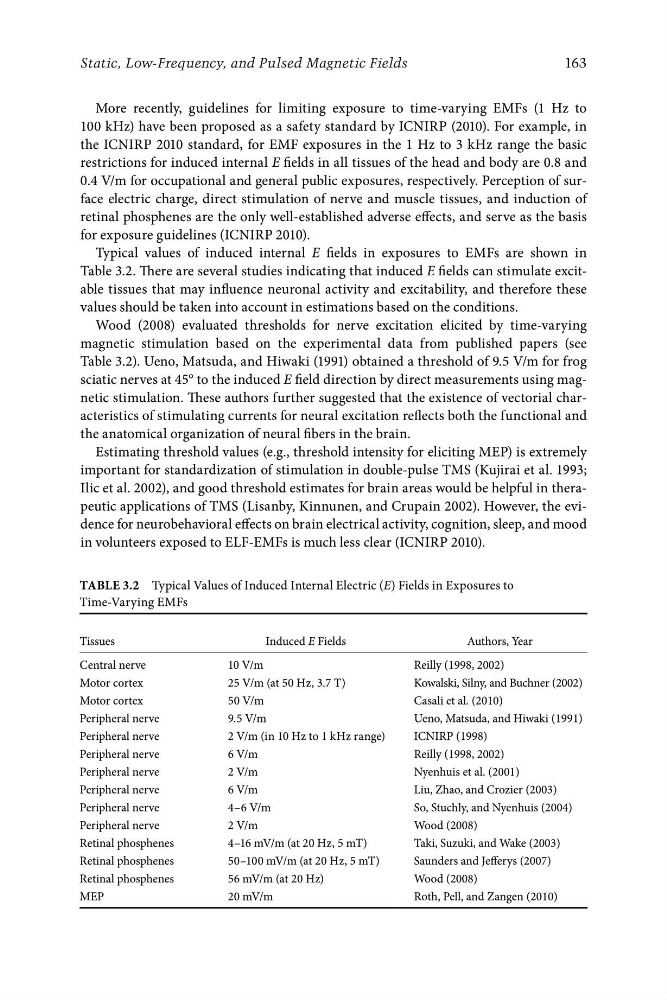
Typical values of induced internal E fields in exposures to EMFs are shown in
Table 3.2. There are several studies indicating that induced E fields can stimulate excitable tissues that may influence neuronal activity and excitability, and therefore these
values should be taken into account in estimations based on the conditions.
Wood (2008) evaluated thresholds for nerve excitation elicited by time-varying
magnetic stimulation based on the experimental data from published papers (see
Table 3.2). Ueno, Matsuda, and Hiwaki (1991) obtained a threshold of 9.5 V/m for frog
sciatic nerves at 45° to the induced E field direction by direct measurements using magnetic stimulation. These authors further suggested that the existence of vectorial characteristics of stimulating currents for neural excitation reflects both the functional and
the anatomical organization of neural fibers in the brain.
Estimating threshold values (e.g., threshold intensity for eliciting MEP) is extremely
important for standardization of stimulation in double-pulse TMS (Kujirai et al. 1993;
Ilic et al. 2002), and good threshold estimates for brain areas would be helpful in therapeutic applications of TMS (Lisanby, Kinnunen, and Crupain 2002). However, the evidence for neurobehavioral effects on brain electrical activity, cognition, sleep, and mood
in volunteers exposed to ELF-EMFs is much less clear (ICNIRP 2010).
Table 3.2 Typical Values of Induced Internal Electric (E) Fields in Exposures to
Time-Varying EMFs
Tissues
Induced E Fields
Authors, Year
Central nerve
10 V/m
Reilly (1998, 2002)
Motor cortex
25 V/m (at 50 Hz, 3.7 T)
Kowalski, Silny, and Buchner (2002)
Motor cortex
50 V/m
Casali et al. (2010)
Peripheral nerve
9.5 V/m
Ueno, Matsuda, and Hiwaki (1991)
Peripheral nerve
2 V/m (in 10 Hz to 1 kHz range)
ICNIRP (1998)
Peripheral nerve
6 V/m
Reilly (1998, 2002)
Peripheral nerve
2 V/m
Nyenhuis et al. (2001)
Peripheral nerve
6 V/m
Liu, Zhao, and Crozier (2003)
Peripheral nerve
4–6 V/m
So, Stuchly, and Nyenhuis (2004)
Peripheral nerve
2 V/m
Wood (2008)
Retinal phosphenes
4–16 mV/m (at 20 Hz, 5 mT)
Taki, Suzuki, and Wake (2003)
Retinal phosphenes
50–100 mV/m (at 20 Hz, 5 mT)
Saunders and Jefferys (2007)
Retinal phosphenes
56 mV/m (at 20 Hz)
Wood (2008)
MEP
20 mV/m
Roth, Pell, and Zangen (2010)
Static, Low-Frequency, and Pulsed Magnetic Fields
More recently, guidelines for limiting exposure to time-varying EMFs (1 Hz to
100 kHz) have been proposed as a safety standard by ICNIRP (2010). For example, in
the ICNIRP 2010 standard, for EMF exposures in the 1 Hz to 3 kHz range the basic
restrictions for induced internal E fields in all tissues of the head and body are 0.8 and
0.4 V/m for occupational and general public exposures, respectively. Perception of surface electric charge, direct stimulation of nerve and muscle tissues, and induction of
retinal phosphenes are the only well-established adverse effects, and serve as the basis
for exposure guidelines (ICNIRP 2010).
Typical values of induced internal E fields in exposures to EMFs are shown in
Table 3.2. There are several studies indicating that induced E fields can stimulate excitable tissues that may influence neuronal activity and excitability, and therefore these
values should be taken into account in estimations based on the conditions.
Wood (2008) evaluated thresholds for nerve excitation elicited by time-varying
magnetic stimulation based on the experimental data from published papers (see
Table 3.2). Ueno, Matsuda, and Hiwaki (1991) obtained a threshold of 9.5 V/m for frog
sciatic nerves at 45° to the induced E field direction by direct measurements using magnetic stimulation. These authors further suggested that the existence of vectorial characteristics of stimulating currents for neural excitation reflects both the functional and
the anatomical organization of neural fibers in the brain.
Estimating threshold values (e.g., threshold intensity for eliciting MEP) is extremely
important for standardization of stimulation in double-pulse TMS (Kujirai et al. 1993;
Ilic et al. 2002), and good threshold estimates for brain areas would be helpful in therapeutic applications of TMS (Lisanby, Kinnunen, and Crupain 2002). However, the evidence for neurobehavioral effects on brain electrical activity, cognition, sleep, and mood
in volunteers exposed to ELF-EMFs is much less clear (ICNIRP 2010).
Table 3.2 Typical Values of Induced Internal Electric (E) Fields in Exposures to
Time-Varying EMFs
Tissues
Induced E Fields
Authors, Year
Central nerve
10 V/m
Reilly (1998, 2002)
Motor cortex
25 V/m (at 50 Hz, 3.7 T)
Kowalski, Silny, and Buchner (2002)
Motor cortex
50 V/m
Casali et al. (2010)
Peripheral nerve
9.5 V/m
Ueno, Matsuda, and Hiwaki (1991)
Peripheral nerve
2 V/m (in 10 Hz to 1 kHz range)
ICNIRP (1998)
Peripheral nerve
6 V/m
Reilly (1998, 2002)
Peripheral nerve
2 V/m
Nyenhuis et al. (2001)
Peripheral nerve
6 V/m
Liu, Zhao, and Crozier (2003)
Peripheral nerve
4–6 V/m
So, Stuchly, and Nyenhuis (2004)
Peripheral nerve
2 V/m
Wood (2008)
Retinal phosphenes
4–16 mV/m (at 20 Hz, 5 mT)
Taki, Suzuki, and Wake (2003)
Retinal phosphenes
50–100 mV/m (at 20 Hz, 5 mT)
Saunders and Jefferys (2007)
Retinal phosphenes
56 mV/m (at 20 Hz)
Wood (2008)
MEP
20 mV/m
Roth, Pell, and Zangen (2010)