

60 ◾ Distillation Control, Optimization, and Tuning
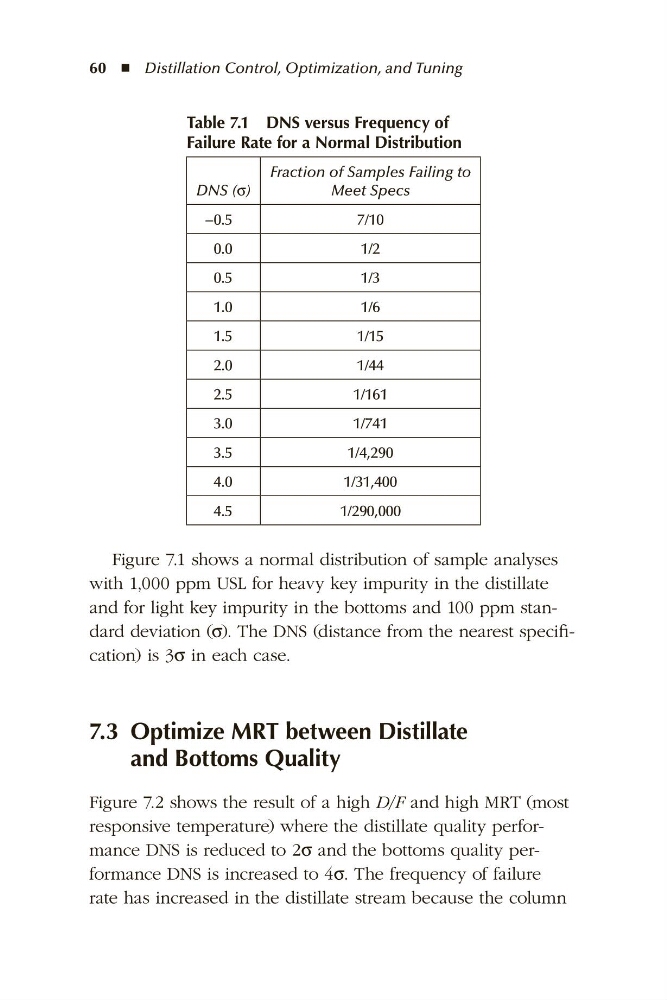
Table 7.1 DNS versus Frequency of
Failure Rate for a Normal Distribution
DNS (σ)
Fraction of Samples Failing to
Meet Specs
−0.5
7/10
0.0
1/2
0.5
1/3
1.0
1/6
1.5
1/15
2.0
1/44
2.5
1/161
3.0
1/741
3.5
1/4,290
4.0
1/31,400
4.5
1/290,000
Figure 7.1 shows a normal distribution of sample analyses
with 1,000 ppm USL for heavy key impurity in the distillate
and for light key impurity in the bottoms and 100 ppm standard deviation (σ). The DNS (distance from the nearest specification) is 3σ in each case.
7.3 Optimize MRT between Distillate
and Bottoms Quality
Figure 7.2 shows the result of a high D/F and high MRT (most
responsive temperature) where the distillate quality performance DNS is reduced to 2σ and the bottoms quality performance DNS is increased to 4σ. The frequency of failure
rate has increased in the distillate stream because the column