

Cyclohexane / n-Heptane
Mole Fraction Light Component in Vapor
1.00
0.80
0.60
0.40
0.20
0.00
Equil
Oper
Diag
0.00
0.20
0.40
0.60
0.80
1.00
Mole Fraction Light Component in Liquid
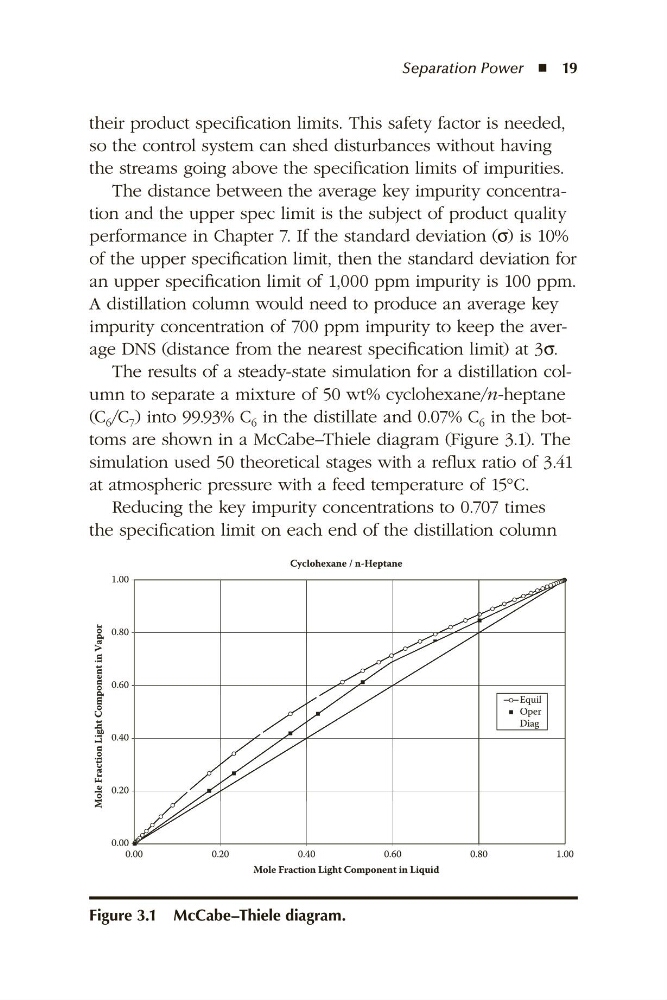
Figure 3.1 McCabe–Thiele diagram.
Separation Power ◾ 19
their product specification limits. This safety factor is needed,
so the control system can shed disturbances without having
the streams going above the specification limits of impurities.
The distance between the average key impurity concentration and the upper spec limit is the subject of product quality
performance in Chapter 7. If the standard deviation (σ) is 10%
of the upper specification limit, then the standard deviation for
an upper specification limit of 1,000 ppm impurity is 100 ppm.
A distillation column would need to produce an average key
impurity concentration of 700 ppm impurity to keep the average DNS (distance from the nearest specification limit) at 3σ.
The results of a steady-state simulation for a distillation column to separate a mixture of 50 wt% cyclohexane/n-heptane
(C 6 /C 7 ) into 99.93% C 6 in the distillate and 0.07% C 6 in the bottoms are shown in a McCabe–Thiele diagram (Figure 3.1). The
simulation used 50 theoretical stages with a reflux ratio of 3.41
at atmospheric pressure with a feed temperature of 15°C.
Reducing the key impurity concentrations to 0.707 times
the specification limit on each end of the distillation column