

Kc = 4.08, Ti = 22 minutes
Process Variable
Controller Output
Process Variable
Controller Output
66
64
62
60
58
56
54
52
50
48
46
100
90
80
70
60
50
40
30
20
10
0
–10
0
10
20
30
40
50
60
70
Time, minutes
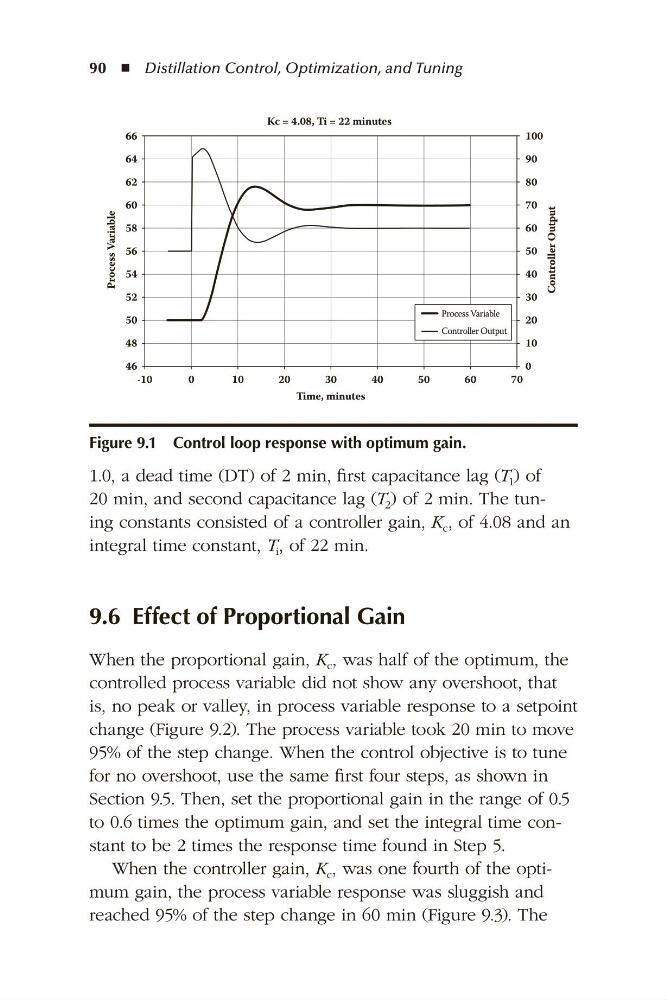
Figure 9.1 Control loop response with optimum gain.
90 ◾ Distillation Control, Optimization, and Tuning
1.0, a dead time (DT) of 2 min, first capacitance lag (T 1 ) of
20 min, and second capacitance lag (T 2 ) of 2 min. The tuning constants consisted of a controller gain, K c , of 4.08 and an
integral time constant, T i , of 22 min.
9.6 Effect of Proportional Gain
When the proportional gain, K c , was half of the optimum, the
controlled process variable did not show any overshoot, that
is, no peak or valley, in process variable response to a setpoint
change (Figure 9.2). The process variable took 20 min to move
95% of the step change. When the control objective is to tune
for no overshoot, use the same first four steps, as shown in
Section 9.5. Then, set the proportional gain in the range of 0.5
to 0.6 times the optimum gain, and set the integral time constant to be 2 times the response time found in Step 5.
When the controller gain, K c , was one fourth of the optimum gain, the process variable response was sluggish and
reached 95% of the step change in 60 min (Figure 9.3). The