

22.4. The discovery of the W
± and Z
0 at the CERN p¯ p collider
399
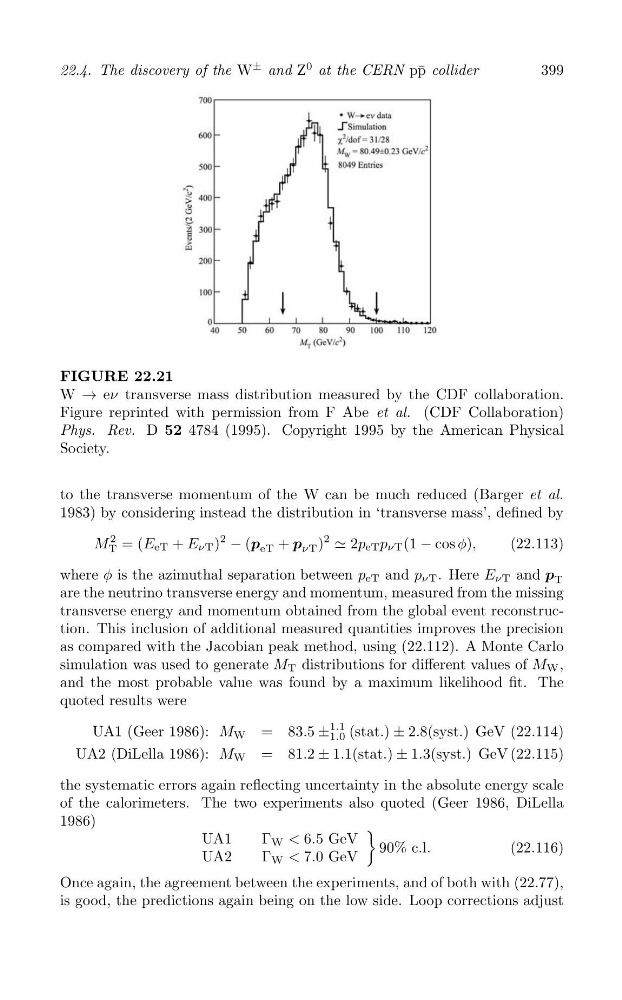
FIGURE 22.21
W → eν transverse mass distribution measured by the CDF collaboration.
Figure reprinted with permission from F Abe et al. (CDF Collaboration)
Phys. Rev. D 52 4784 (1995). Copyright 1995 by the American Physical
Society.
to the transverse momentum of the W can be much reduced (Barger et al.
1983) by considering instead the distribution in ‘transverse mass’, defined by
M T
2 = (E eT + E νT )
2
− (p eT + p νT )
2
⋍ 2p eT p νT (1 − cos φ),
(22.113)
where φ is the azimuthal separation between p eT and p νT . Here E νT and p T
are the neutrino transverse energy and momentum, measured from the missing
transverse energy and momentum obtained from the global event reconstruction. This inclusion of additional measured quantities improves the precision
as compared with the Jacobian peak method, using (22.112). A Monte Carlo
simulation was used to generate M T distributions for different values of M W ,
and the most probable value was found by a maximum likelihood fit. The
quoted results were
UA1 (Geer 1986): M W = 83.5 ±
1
1
.
.
1
0 (stat.) ± 2.8(syst.) GeV (22.114)
UA2 (DiLella 1986): M W = 81.2 ± 1.1(stat.) ± 1.3(syst.) GeV (22.115)
the systematic errors again reflecting uncertainty in the absolute energy scale
of the calorimeters. The two experiments also quoted (Geer 1986, DiLella
1986)
)
UA1
Γ W < 6.5 GeV 90% c.l.
(22.116)
UA2
Γ W < 7.0 GeV
Once again, the agreement between the experiments, and of both with (22.77),
is good, the predictions again being on the low side. Loop corrections adjust
± and Z
0 at the CERN p¯ p collider
399
FIGURE 22.21
W → eν transverse mass distribution measured by the CDF collaboration.
Figure reprinted with permission from F Abe et al. (CDF Collaboration)
Phys. Rev. D 52 4784 (1995). Copyright 1995 by the American Physical
Society.
to the transverse momentum of the W can be much reduced (Barger et al.
1983) by considering instead the distribution in ‘transverse mass’, defined by
M T
2 = (E eT + E νT )
2
− (p eT + p νT )
2
⋍ 2p eT p νT (1 − cos φ),
(22.113)
where φ is the azimuthal separation between p eT and p νT . Here E νT and p T
are the neutrino transverse energy and momentum, measured from the missing
transverse energy and momentum obtained from the global event reconstruction. This inclusion of additional measured quantities improves the precision
as compared with the Jacobian peak method, using (22.112). A Monte Carlo
simulation was used to generate M T distributions for different values of M W ,
and the most probable value was found by a maximum likelihood fit. The
quoted results were
UA1 (Geer 1986): M W = 83.5 ±
1
1
.
.
1
0 (stat.) ± 2.8(syst.) GeV (22.114)
UA2 (DiLella 1986): M W = 81.2 ± 1.1(stat.) ± 1.3(syst.) GeV (22.115)
the systematic errors again reflecting uncertainty in the absolute energy scale
of the calorimeters. The two experiments also quoted (Geer 1986, DiLella
1986)
)
UA1
Γ W < 6.5 GeV 90% c.l.
(22.116)
UA2
Γ W < 7.0 GeV
Once again, the agreement between the experiments, and of both with (22.77),
is good, the predictions again being on the low side. Loop corrections adjust