

334
21. CP Violation and Oscillation Phenomena
r B
x
y
r B
(x − , y − )
(x + , y + )
γ
γ
δ B
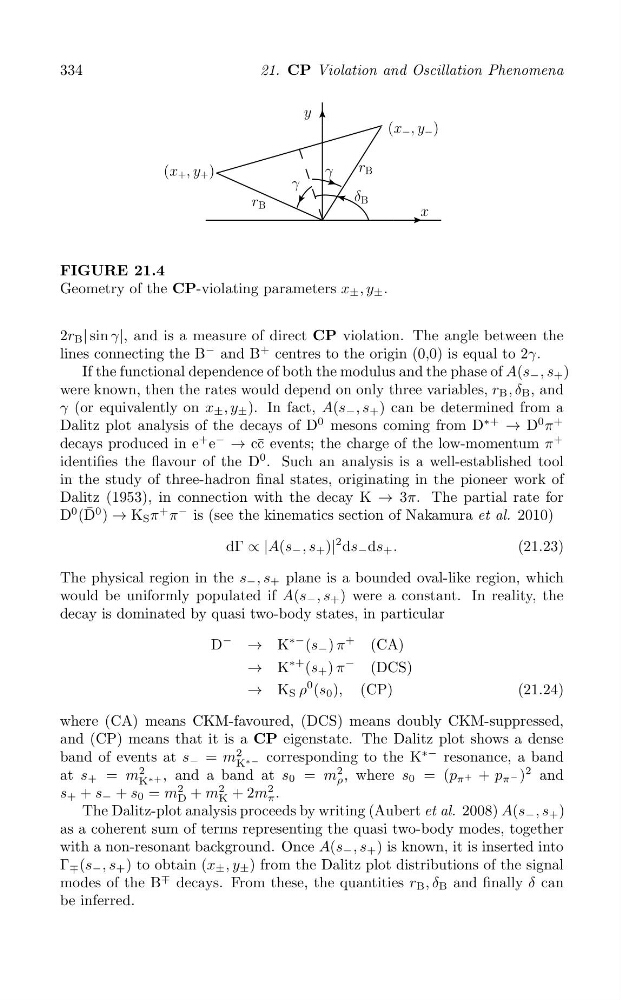
FIGURE 21.4
Geometry of the CP-violating parameters x ± , y ± .
2r B | sin γ|, and is a measure of direct CP violation. The angle between the
lines connecting the B
− and B
+ centres to the origin (0,0) is equal to 2γ.
If the functional dependence of both the modulus and the phase of A(s − , s + )
were known, then the rates would depend on only three variables, r B , δ B , and
γ (or equivalently on x ± , y ± ). In fact, A(s − , s + ) can be determined from a
Dalitz plot analysis of the decays of D
0 mesons coming from D
∗+
→ D
0 π
+
−
decays produced in e
+ e → c¯ c events; the charge of the low-momentum π
+
identifies the flavour of the D
0 . Such an analysis is a well-established tool
in the study of three-hadron final states, originating in the pioneer work of
Dalitz (1953), in connection with the decay K → 3π. The partial rate for
D
0 (D ¯ 0 ) → K S π
+ π
− is (see the kinematics section of Nakamura et al. 2010)
dΓ ∝ |A(s − , s + )|
2 ds − ds + .
(21.23)
The physical region in the s − , s + plane is a bounded oval-like region, which
would be uniformly populated if A(s − , s + ) were a constant. In reality, the
decay is dominated by quasi two-body states, in particular
→ K
∗− (s − ) π
+
D
−
(CA)
→ K
∗+ (s + ) π
−
(DCS)
→ K S ρ
0 (s 0 ), (CP)
(21.24)
where (CA) means CKM-favoured, (DCS) means doubly CKM-suppressed,
and (CP) means that it is a CP eigenstate. The Dalitz plot shows a dense
2
band of events at s − = m K ∗− corresponding to the K
∗− resonance, a band
2
2
at s + = m
, and a band at s 0 = m ρ , where s 0 = (p π + + p π − )
2 and
K ∗+
2
2
2
s + + s − + s 0 = m D + m + 2m π .
K
The Dalitz-plot analysis proceeds by writing (Aubert et al. 2008) A(s − , s + )
as a coherent sum of terms representing the quasi two-body modes, together
with a non-resonant background. Once A(s − , s + ) is known, it is inserted into
Γ ∓ (s − , s + ) to obtain (x ± , y ± ) from the Dalitz plot distributions of the signal
modes of the B
∓ decays. From these, the quantities r B , δ B and finally δ can
be inferred.
21. CP Violation and Oscillation Phenomena
r B
x
y
r B
(x − , y − )
(x + , y + )
γ
γ
δ B
FIGURE 21.4
Geometry of the CP-violating parameters x ± , y ± .
2r B | sin γ|, and is a measure of direct CP violation. The angle between the
lines connecting the B
− and B
+ centres to the origin (0,0) is equal to 2γ.
If the functional dependence of both the modulus and the phase of A(s − , s + )
were known, then the rates would depend on only three variables, r B , δ B , and
γ (or equivalently on x ± , y ± ). In fact, A(s − , s + ) can be determined from a
Dalitz plot analysis of the decays of D
0 mesons coming from D
∗+
→ D
0 π
+
−
decays produced in e
+ e → c¯ c events; the charge of the low-momentum π
+
identifies the flavour of the D
0 . Such an analysis is a well-established tool
in the study of three-hadron final states, originating in the pioneer work of
Dalitz (1953), in connection with the decay K → 3π. The partial rate for
D
0 (D ¯ 0 ) → K S π
+ π
− is (see the kinematics section of Nakamura et al. 2010)
dΓ ∝ |A(s − , s + )|
2 ds − ds + .
(21.23)
The physical region in the s − , s + plane is a bounded oval-like region, which
would be uniformly populated if A(s − , s + ) were a constant. In reality, the
decay is dominated by quasi two-body states, in particular
→ K
∗− (s − ) π
+
D
−
(CA)
→ K
∗+ (s + ) π
−
(DCS)
→ K S ρ
0 (s 0 ), (CP)
(21.24)
where (CA) means CKM-favoured, (DCS) means doubly CKM-suppressed,
and (CP) means that it is a CP eigenstate. The Dalitz plot shows a dense
2
band of events at s − = m K ∗− corresponding to the K
∗− resonance, a band
2
2
at s + = m
, and a band at s 0 = m ρ , where s 0 = (p π + + p π − )
2 and
K ∗+
2
2
2
s + + s − + s 0 = m D + m + 2m π .
K
The Dalitz-plot analysis proceeds by writing (Aubert et al. 2008) A(s − , s + )
as a coherent sum of terms representing the quasi two-body modes, together
with a non-resonant background. Once A(s − , s + ) is known, it is inserted into
Γ ∓ (s − , s + ) to obtain (x ± , y ± ) from the Dalitz plot distributions of the signal
modes of the B
∓ decays. From these, the quantities r B , δ B and finally δ can
be inferred.