

400 400
200 200
0.5 0.5
0 0
-0.5 -0.5
450 450
225 225
0.5 0.5
0 0
-0.5 -0.5
tags
0
B
tags
0
B
a)
b)
tags
0
B
tags
0
B
c)
[ps]
t
Δ
-5
0
-5
5
[ps]
t
Δ
0
5
d)
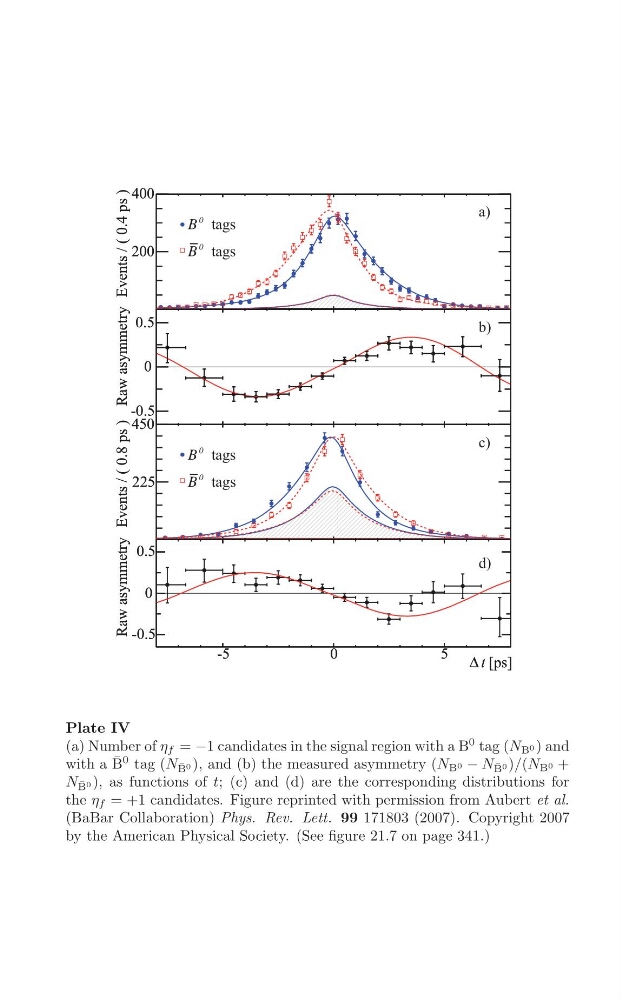
Plate IV
(a) Number of η f = −1 candidates in the signal region with a B
0 tag (N B 0 ) and
with a B ¯ 0 tag (N B ¯ 0 ), and (b) the measured asymmetry (N B 0 − N B ¯ 0 )/(N B 0 +
N B ¯ 0 ), as functions of t; (c) and (d) are the corresponding distributions for
the η f = +1 candidates. Figure reprinted with permission from Aubert et al.
(BaBar Collaboration) Phys. Rev. Lett. 99 171803 (2007). Copyright 2007
by the American Physical Society. (See figure 21.7 on page 341.)
Events / ( 0.4 ps )
Events / ( 0.4 ps )
Raw asymmetry
Raw asymmetry
Events / ( 0.8 ps )
Events / ( 0.8 ps )
Raw asymmetry
Raw asymmetry