

185
16.5. Lattice QCD
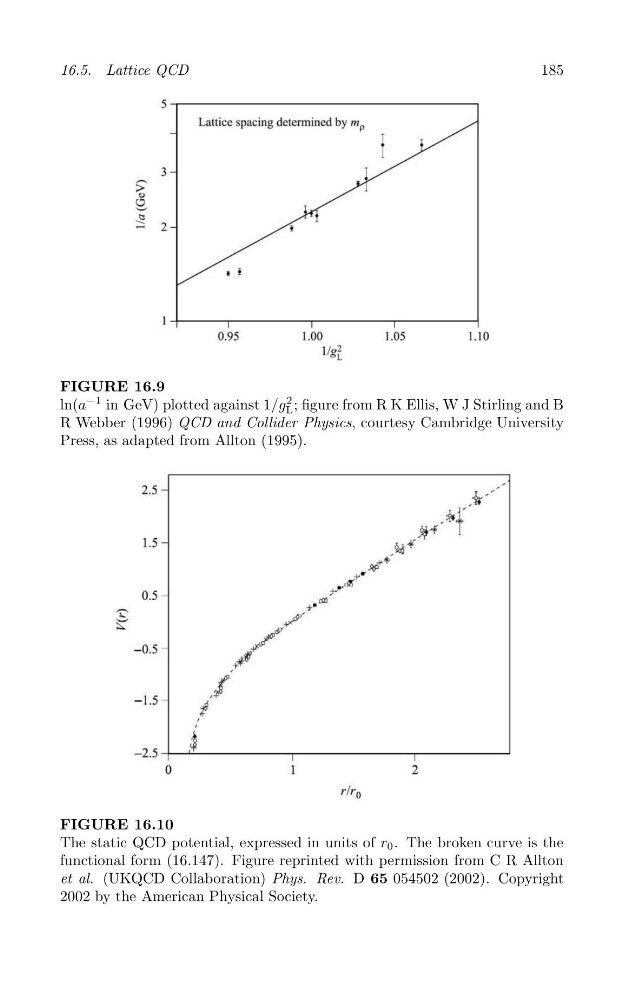
FIGURE 16.9
ln(a
−1 in GeV) plotted against 1/g
2 ; figure from R K Ellis, W J Stirling and B
L
R Webber (1996) QCD and Collider Physics, courtesy Cambridge University
Press, as adapted from Allton (1995).
FIGURE 16.10
The static QCD potential, expressed in units of r 0 . The broken curve is the
functional form (16.147). Figure reprinted with permission from C R Allton
et al. (UKQCD Collaboration) Phys. Rev. D 65 054502 (2002). Copyright
2002 by the American Physical Society.