

5.3 Why Environmental Footprints Are Important for Making …
75
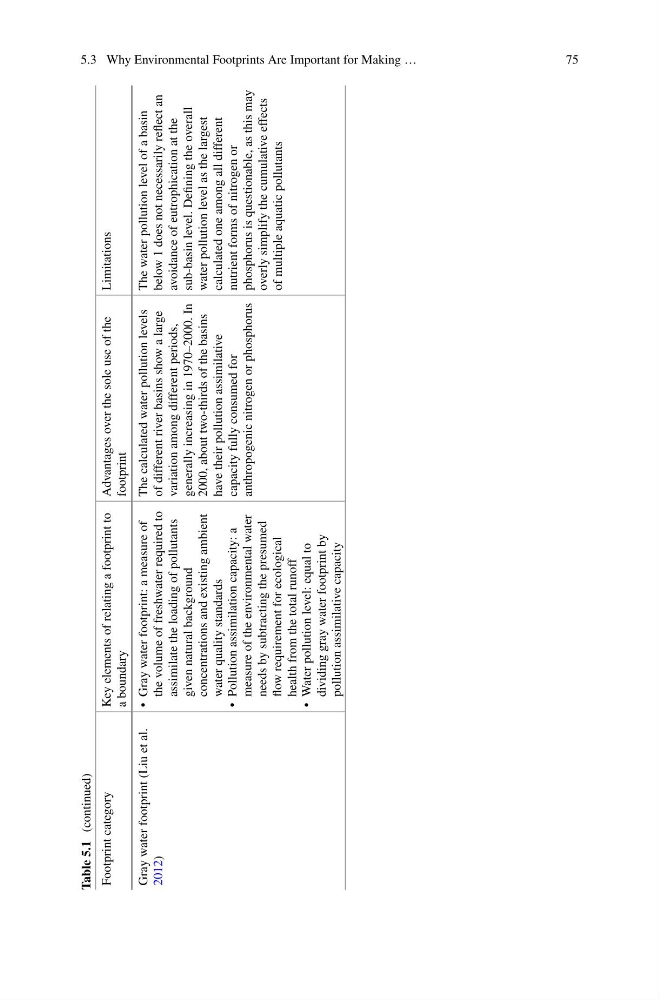
Table 5.1
(continued)
Footprint category
Key elements of relating a footprint to
a boundary
Advantages over the sole use of the
footprint
Limitations
Gray water footprint (Liu et al.
2012)
• Gray water footprint: a measure of
the volume of freshwater required to
assimilate the loading of pollutants
given natural background
concentrations and existing ambient
water quality standards
• Pollution assimilation capacity: a
measure of the environmental water
needs by subtracting the presumed
flow requirement for ecological
health from the total runoff
• Water pollution level: equal to
dividing gray water footprint by
pollution assimilative capacity
The calculated water pollution levels
of different river basins show a large
variation among different periods,
generally increasing in 1970–2000. In
2000, about two-thirds of the basins
have their pollution assimilative
capacity fully consumed for
anthropogenic nitrogen or phosphorus
The water pollution level of a basin
below 1 does not necessarily reflect an
avoidance of eutrophication at the
sub-basin level. Defining the overall
water pollution level as the largest
calculated one among all different
nutrient forms of nitrogen or
phosphorus is questionable, as this may
overly simplify the cumulative effects
of multiple aquatic pollutants
75
Table 5.1
(continued)
Footprint category
Key elements of relating a footprint to
a boundary
Advantages over the sole use of the
footprint
Limitations
Gray water footprint (Liu et al.
2012)
• Gray water footprint: a measure of
the volume of freshwater required to
assimilate the loading of pollutants
given natural background
concentrations and existing ambient
water quality standards
• Pollution assimilation capacity: a
measure of the environmental water
needs by subtracting the presumed
flow requirement for ecological
health from the total runoff
• Water pollution level: equal to
dividing gray water footprint by
pollution assimilative capacity
The calculated water pollution levels
of different river basins show a large
variation among different periods,
generally increasing in 1970–2000. In
2000, about two-thirds of the basins
have their pollution assimilative
capacity fully consumed for
anthropogenic nitrogen or phosphorus
The water pollution level of a basin
below 1 does not necessarily reflect an
avoidance of eutrophication at the
sub-basin level. Defining the overall
water pollution level as the largest
calculated one among all different
nutrient forms of nitrogen or
phosphorus is questionable, as this may
overly simplify the cumulative effects
of multiple aquatic pollutants