

108
6 Benchmarking the Carbon, Water and Land Footprints …
0
0.5
1
1.5
2
2.5
3
Hoekstra and Wiedmann
Rockström et al.
This thesis
Ratio of pressure to threshold
Carbon emissons
Water use
Land use
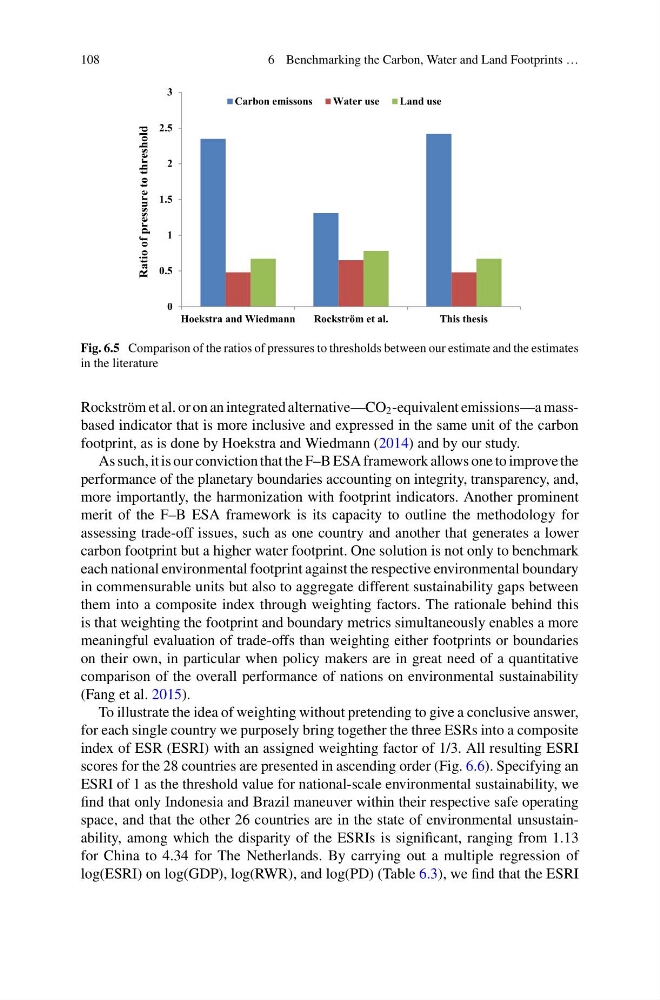
Fig. 6.5 Comparison of the ratios of pressures to thresholds between our estimate and the estimates
in the literature
Rockström et al. or on an integrated alternative—CO 2 -equivalent emissions—a massbased indicator that is more inclusive and expressed in the same unit of the carbon
footprint, as is done by Hoekstra and Wiedmann (2014) and by our study.
As such, it is our conviction that the F–B ESA framework allows one to improve the
performance of the planetary boundaries accounting on integrity, transparency, and,
more importantly, the harmonization with footprint indicators. Another prominent
merit of the F–B ESA framework is its capacity to outline the methodology for
assessing trade-off issues, such as one country and another that generates a lower
carbon footprint but a higher water footprint. One solution is not only to benchmark
each national environmental footprint against the respective environmental boundary
in commensurable units but also to aggregate different sustainability gaps between
them into a composite index through weighting factors. The rationale behind this
is that weighting the footprint and boundary metrics simultaneously enables a more
meaningful evaluation of trade-offs than weighting either footprints or boundaries
on their own, in particular when policy makers are in great need of a quantitative
comparison of the overall performance of nations on environmental sustainability
(Fang et al. 2015).
To illustrate the idea of weighting without pretending to give a conclusive answer,
for each single country we purposely bring together the three ESRs into a composite
index of ESR (ESRI) with an assigned weighting factor of 1/3. All resulting ESRI
scores for the 28 countries are presented in ascending order (Fig. 6.6). Specifying an
ESRI of 1 as the threshold value for national-scale environmental sustainability, we
find that only Indonesia and Brazil maneuver within their respective safe operating
space, and that the other 26 countries are in the state of environmental unsustainability, among which the disparity of the ESRIs is significant, ranging from 1.13
for China to 4.34 for The Netherlands. By carrying out a multiple regression of
log(ESRI) on log(GDP), log(RWR), and log(PD) (Table 6.3), we find that the ESRI
6 Benchmarking the Carbon, Water and Land Footprints …
0
0.5
1
1.5
2
2.5
3
Hoekstra and Wiedmann
Rockström et al.
This thesis
Ratio of pressure to threshold
Carbon emissons
Water use
Land use
Fig. 6.5 Comparison of the ratios of pressures to thresholds between our estimate and the estimates
in the literature
Rockström et al. or on an integrated alternative—CO 2 -equivalent emissions—a massbased indicator that is more inclusive and expressed in the same unit of the carbon
footprint, as is done by Hoekstra and Wiedmann (2014) and by our study.
As such, it is our conviction that the F–B ESA framework allows one to improve the
performance of the planetary boundaries accounting on integrity, transparency, and,
more importantly, the harmonization with footprint indicators. Another prominent
merit of the F–B ESA framework is its capacity to outline the methodology for
assessing trade-off issues, such as one country and another that generates a lower
carbon footprint but a higher water footprint. One solution is not only to benchmark
each national environmental footprint against the respective environmental boundary
in commensurable units but also to aggregate different sustainability gaps between
them into a composite index through weighting factors. The rationale behind this
is that weighting the footprint and boundary metrics simultaneously enables a more
meaningful evaluation of trade-offs than weighting either footprints or boundaries
on their own, in particular when policy makers are in great need of a quantitative
comparison of the overall performance of nations on environmental sustainability
(Fang et al. 2015).
To illustrate the idea of weighting without pretending to give a conclusive answer,
for each single country we purposely bring together the three ESRs into a composite
index of ESR (ESRI) with an assigned weighting factor of 1/3. All resulting ESRI
scores for the 28 countries are presented in ascending order (Fig. 6.6). Specifying an
ESRI of 1 as the threshold value for national-scale environmental sustainability, we
find that only Indonesia and Brazil maneuver within their respective safe operating
space, and that the other 26 countries are in the state of environmental unsustainability, among which the disparity of the ESRIs is significant, ranging from 1.13
for China to 4.34 for The Netherlands. By carrying out a multiple regression of
log(ESRI) on log(GDP), log(RWR), and log(PD) (Table 6.3), we find that the ESRI