

6.2 Methods
97
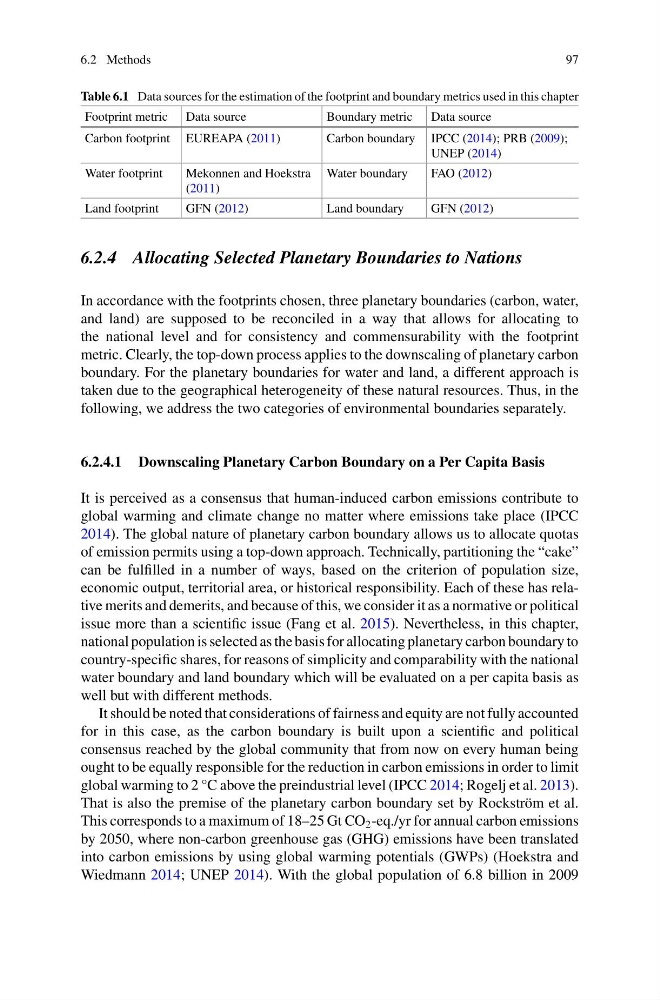
Table 6.1 Data sources for the estimation of the footprint and boundary metrics used in this chapter
Footprint metric Data source
Boundary metric Data source
Carbon footprint EUREAPA (2011)
Carbon boundary IPCC (2014); PRB (2009);
UNEP (2014)
Water footprint
Mekonnen and Hoekstra
(2011)
Water boundary
FAO (2012)
Land footprint
GFN (2012)
Land boundary
GFN (2012)
6.2.4 Allocating Selected Planetary Boundaries to Nations
In accordance with the footprints chosen, three planetary boundaries (carbon, water,
and land) are supposed to be reconciled in a way that allows for allocating to
the national level and for consistency and commensurability with the footprint
metric. Clearly, the top-down process applies to the downscaling of planetary carbon
boundary. For the planetary boundaries for water and land, a different approach is
taken due to the geographical heterogeneity of these natural resources. Thus, in the
following, we address the two categories of environmental boundaries separately.
6.2.4.1 Downscaling Planetary Carbon Boundary on a Per Capita Basis
It is perceived as a consensus that human-induced carbon emissions contribute to
global warming and climate change no matter where emissions take place (IPCC
2014). The global nature of planetary carbon boundary allows us to allocate quotas
of emission permits using a top-down approach. Technically, partitioning the “cake”
can be fulfilled in a number of ways, based on the criterion of population size,
economic output, territorial area, or historical responsibility. Each of these has relative merits and demerits, and because of this, we consider it as a normative or political
issue more than a scientific issue (Fang et al. 2015). Nevertheless, in this chapter,
national population is selected as the basis for allocating planetary carbon boundary to
country-specific shares, for reasons of simplicity and comparability with the national
water boundary and land boundary which will be evaluated on a per capita basis as
well but with different methods.
It should be noted that considerations of fairness and equity are not fully accounted
for in this case, as the carbon boundary is built upon a scientific and political
consensus reached by the global community that from now on every human being
ought to be equally responsible for the reduction in carbon emissions in order to limit
global warming to 2 °C above the preindustrial level (IPCC 2014; Rogelj et al. 2013).
That is also the premise of the planetary carbon boundary set by Rockström et al.
This corresponds to a maximum of 18–25 Gt CO 2 -eq./yr for annual carbon emissions
by 2050, where non-carbon greenhouse gas (GHG) emissions have been translated
into carbon emissions by using global warming potentials (GWPs) (Hoekstra and
Wiedmann 2014; UNEP 2014). With the global population of 6.8 billion in 2009
97
Table 6.1 Data sources for the estimation of the footprint and boundary metrics used in this chapter
Footprint metric Data source
Boundary metric Data source
Carbon footprint EUREAPA (2011)
Carbon boundary IPCC (2014); PRB (2009);
UNEP (2014)
Water footprint
Mekonnen and Hoekstra
(2011)
Water boundary
FAO (2012)
Land footprint
GFN (2012)
Land boundary
GFN (2012)
6.2.4 Allocating Selected Planetary Boundaries to Nations
In accordance with the footprints chosen, three planetary boundaries (carbon, water,
and land) are supposed to be reconciled in a way that allows for allocating to
the national level and for consistency and commensurability with the footprint
metric. Clearly, the top-down process applies to the downscaling of planetary carbon
boundary. For the planetary boundaries for water and land, a different approach is
taken due to the geographical heterogeneity of these natural resources. Thus, in the
following, we address the two categories of environmental boundaries separately.
6.2.4.1 Downscaling Planetary Carbon Boundary on a Per Capita Basis
It is perceived as a consensus that human-induced carbon emissions contribute to
global warming and climate change no matter where emissions take place (IPCC
2014). The global nature of planetary carbon boundary allows us to allocate quotas
of emission permits using a top-down approach. Technically, partitioning the “cake”
can be fulfilled in a number of ways, based on the criterion of population size,
economic output, territorial area, or historical responsibility. Each of these has relative merits and demerits, and because of this, we consider it as a normative or political
issue more than a scientific issue (Fang et al. 2015). Nevertheless, in this chapter,
national population is selected as the basis for allocating planetary carbon boundary to
country-specific shares, for reasons of simplicity and comparability with the national
water boundary and land boundary which will be evaluated on a per capita basis as
well but with different methods.
It should be noted that considerations of fairness and equity are not fully accounted
for in this case, as the carbon boundary is built upon a scientific and political
consensus reached by the global community that from now on every human being
ought to be equally responsible for the reduction in carbon emissions in order to limit
global warming to 2 °C above the preindustrial level (IPCC 2014; Rogelj et al. 2013).
That is also the premise of the planetary carbon boundary set by Rockström et al.
This corresponds to a maximum of 18–25 Gt CO 2 -eq./yr for annual carbon emissions
by 2050, where non-carbon greenhouse gas (GHG) emissions have been translated
into carbon emissions by using global warming potentials (GWPs) (Hoekstra and
Wiedmann 2014; UNEP 2014). With the global population of 6.8 billion in 2009