

364
M. Kejna et al.
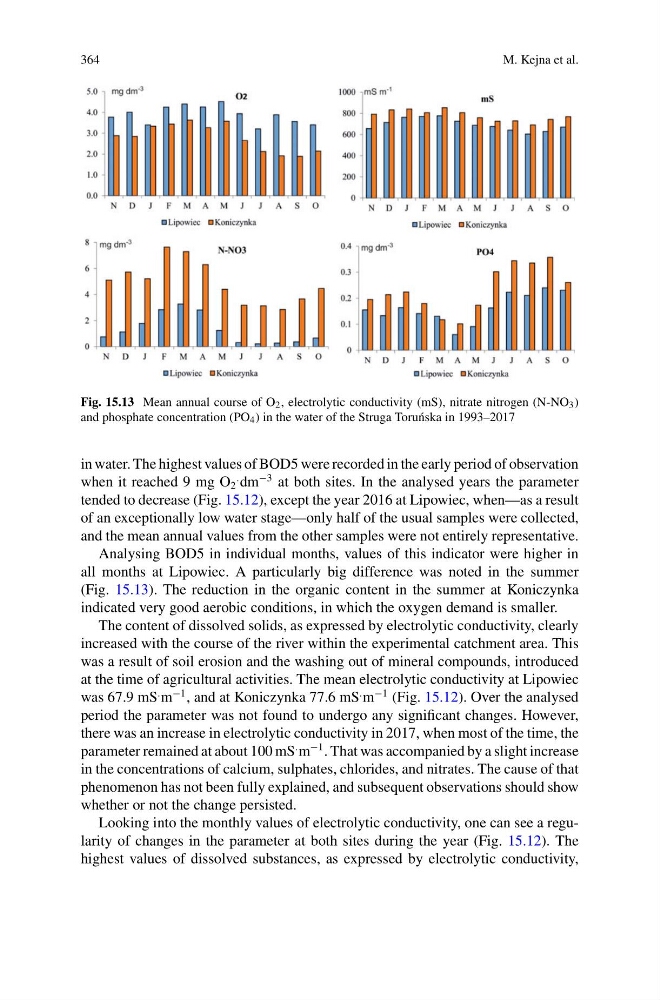
Fig. 15.13 Mean annual course of O 2 , electrolytic conductivity (mS), nitrate nitrogen (N-NO 3 )
and phosphate concentration (PO 4 ) in the water of the Struga Toru´ nska in 1993–2017
in water. The highest values of BOD5 were recorded in the early period of observation
when it reached 9 mg O 2
. dm
−3 at both sites. In the analysed years the parameter
tended to decrease (Fig. 15.12), except the year 2016 at Lipowiec, when—as a result
of an exceptionally low water stage—only half of the usual samples were collected,
and the mean annual values from the other samples were not entirely representative.
Analysing BOD5 in individual months, values of this indicator were higher in
all months at Lipowiec. A particularly big difference was noted in the summer
(Fig. 15.13). The reduction in the organic content in the summer at Koniczynka
indicated very good aerobic conditions, in which the oxygen demand is smaller.
The content of dissolved solids, as expressed by electrolytic conductivity, clearly
increased with the course of the river within the experimental catchment area. This
was a result of soil erosion and the washing out of mineral compounds, introduced
at the time of agricultural activities. The mean electrolytic conductivity at Lipowiec
was 67.9 mS
. m
−1 , and at Koniczynka 77.6 mS
. m
−1 (Fig. 15.12). Over the analysed
period the parameter was not found to undergo any significant changes. However,
there was an increase in electrolytic conductivity in 2017, when most of the time, the
parameter remained at about 100 mS
. m
−1 . That was accompanied by a slight increase
in the concentrations of calcium, sulphates, chlorides, and nitrates. The cause of that
phenomenon has not been fully explained, and subsequent observations should show
whether or not the change persisted.
Looking into the monthly values of electrolytic conductivity, one can see a regularity of changes in the parameter at both sites during the year (Fig. 15.12). The
highest values of dissolved substances, as expressed by electrolytic conductivity,
M. Kejna et al.
Fig. 15.13 Mean annual course of O 2 , electrolytic conductivity (mS), nitrate nitrogen (N-NO 3 )
and phosphate concentration (PO 4 ) in the water of the Struga Toru´ nska in 1993–2017
in water. The highest values of BOD5 were recorded in the early period of observation
when it reached 9 mg O 2
. dm
−3 at both sites. In the analysed years the parameter
tended to decrease (Fig. 15.12), except the year 2016 at Lipowiec, when—as a result
of an exceptionally low water stage—only half of the usual samples were collected,
and the mean annual values from the other samples were not entirely representative.
Analysing BOD5 in individual months, values of this indicator were higher in
all months at Lipowiec. A particularly big difference was noted in the summer
(Fig. 15.13). The reduction in the organic content in the summer at Koniczynka
indicated very good aerobic conditions, in which the oxygen demand is smaller.
The content of dissolved solids, as expressed by electrolytic conductivity, clearly
increased with the course of the river within the experimental catchment area. This
was a result of soil erosion and the washing out of mineral compounds, introduced
at the time of agricultural activities. The mean electrolytic conductivity at Lipowiec
was 67.9 mS
. m
−1 , and at Koniczynka 77.6 mS
. m
−1 (Fig. 15.12). Over the analysed
period the parameter was not found to undergo any significant changes. However,
there was an increase in electrolytic conductivity in 2017, when most of the time, the
parameter remained at about 100 mS
. m
−1 . That was accompanied by a slight increase
in the concentrations of calcium, sulphates, chlorides, and nitrates. The cause of that
phenomenon has not been fully explained, and subsequent observations should show
whether or not the change persisted.
Looking into the monthly values of electrolytic conductivity, one can see a regularity of changes in the parameter at both sites during the year (Fig. 15.12). The
highest values of dissolved substances, as expressed by electrolytic conductivity,