

2 Assessment of Water Resources in Poland
19
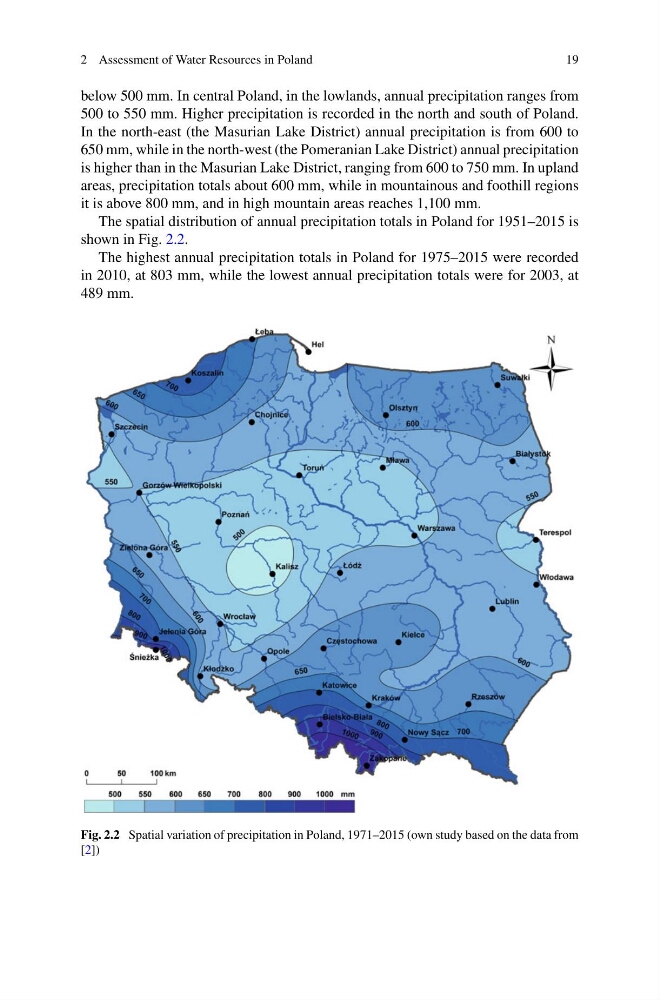
below 500 mm. In central Poland, in the lowlands, annual precipitation ranges from
500 to 550 mm. Higher precipitation is recorded in the north and south of Poland.
In the north-east (the Masurian Lake District) annual precipitation is from 600 to
650 mm, while in the north-west (the Pomeranian Lake District) annual precipitation
is higher than in the Masurian Lake District, ranging from 600 to 750 mm. In upland
areas, precipitation totals about 600 mm, while in mountainous and foothill regions
it is above 800 mm, and in high mountain areas reaches 1,100 mm.
The spatial distribution of annual precipitation totals in Poland for 1951–2015 is
shown in Fig. 2.2.
The highest annual precipitation totals in Poland for 1975–2015 were recorded
in 2010, at 803 mm, while the lowest annual precipitation totals were for 2003, at
489 mm.
Fig. 2.2 Spatial variation of precipitation in Poland, 1971–2015 (own study based on the data from
[2])
19
below 500 mm. In central Poland, in the lowlands, annual precipitation ranges from
500 to 550 mm. Higher precipitation is recorded in the north and south of Poland.
In the north-east (the Masurian Lake District) annual precipitation is from 600 to
650 mm, while in the north-west (the Pomeranian Lake District) annual precipitation
is higher than in the Masurian Lake District, ranging from 600 to 750 mm. In upland
areas, precipitation totals about 600 mm, while in mountainous and foothill regions
it is above 800 mm, and in high mountain areas reaches 1,100 mm.
The spatial distribution of annual precipitation totals in Poland for 1951–2015 is
shown in Fig. 2.2.
The highest annual precipitation totals in Poland for 1975–2015 were recorded
in 2010, at 803 mm, while the lowest annual precipitation totals were for 2003, at
489 mm.
Fig. 2.2 Spatial variation of precipitation in Poland, 1971–2015 (own study based on the data from
[2])