

278
M. Habel et al.
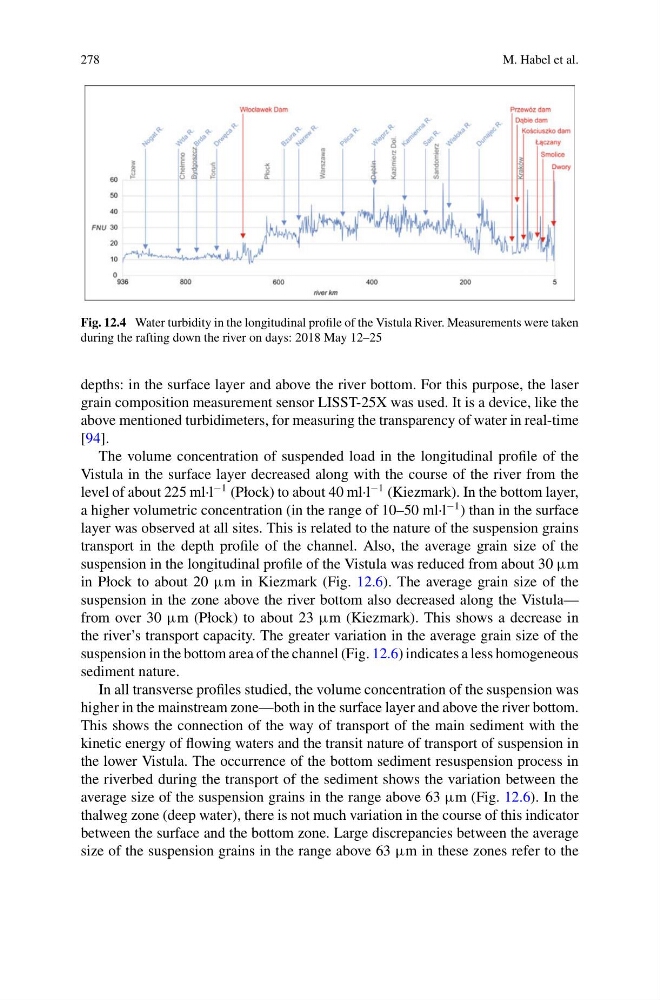
Fig. 12.4 Water turbidity in the longitudinal profile of the Vistula River. Measurements were taken
during the rafting down the river on days: 2018 May 12–25
depths: in the surface layer and above the river bottom. For this purpose, the laser
grain composition measurement sensor LISST-25X was used. It is a device, like the
above mentioned turbidimeters, for measuring the transparency of water in real-time
[94].
The volume concentration of suspended load in the longitudinal profile of the
Vistula in the surface layer decreased along with the course of the river from the
level of about 225 ml·l
−1 (Płock) to about 40 ml·l
−1 (Kiezmark). In the bottom layer,
a higher volumetric concentration (in the range of 10–50 ml·l
−1 ) than in the surface
layer was observed at all sites. This is related to the nature of the suspension grains
transport in the depth profile of the channel. Also, the average grain size of the
suspension in the longitudinal profile of the Vistula was reduced from about 30 µm
in Płock to about 20 µm in Kiezmark (Fig. 12.6). The average grain size of the
suspension in the zone above the river bottom also decreased along the Vistula—
from over 30 µm (Płock) to about 23 µm (Kiezmark). This shows a decrease in
the river’s transport capacity. The greater variation in the average grain size of the
suspension in the bottom area of the channel (Fig. 12.6) indicates a less homogeneous
sediment nature.
In all transverse profiles studied, the volume concentration of the suspension was
higher in the mainstream zone—both in the surface layer and above the river bottom.
This shows the connection of the way of transport of the main sediment with the
kinetic energy of flowing waters and the transit nature of transport of suspension in
the lower Vistula. The occurrence of the bottom sediment resuspension process in
the riverbed during the transport of the sediment shows the variation between the
average size of the suspension grains in the range above 63 µm (Fig. 12.6). In the
thalweg zone (deep water), there is not much variation in the course of this indicator
between the surface and the bottom zone. Large discrepancies between the average
size of the suspension grains in the range above 63 µm in these zones refer to the
M. Habel et al.
Fig. 12.4 Water turbidity in the longitudinal profile of the Vistula River. Measurements were taken
during the rafting down the river on days: 2018 May 12–25
depths: in the surface layer and above the river bottom. For this purpose, the laser
grain composition measurement sensor LISST-25X was used. It is a device, like the
above mentioned turbidimeters, for measuring the transparency of water in real-time
[94].
The volume concentration of suspended load in the longitudinal profile of the
Vistula in the surface layer decreased along with the course of the river from the
level of about 225 ml·l
−1 (Płock) to about 40 ml·l
−1 (Kiezmark). In the bottom layer,
a higher volumetric concentration (in the range of 10–50 ml·l
−1 ) than in the surface
layer was observed at all sites. This is related to the nature of the suspension grains
transport in the depth profile of the channel. Also, the average grain size of the
suspension in the longitudinal profile of the Vistula was reduced from about 30 µm
in Płock to about 20 µm in Kiezmark (Fig. 12.6). The average grain size of the
suspension in the zone above the river bottom also decreased along the Vistula—
from over 30 µm (Płock) to about 23 µm (Kiezmark). This shows a decrease in
the river’s transport capacity. The greater variation in the average grain size of the
suspension in the bottom area of the channel (Fig. 12.6) indicates a less homogeneous
sediment nature.
In all transverse profiles studied, the volume concentration of the suspension was
higher in the mainstream zone—both in the surface layer and above the river bottom.
This shows the connection of the way of transport of the main sediment with the
kinetic energy of flowing waters and the transit nature of transport of suspension in
the lower Vistula. The occurrence of the bottom sediment resuspension process in
the riverbed during the transport of the sediment shows the variation between the
average size of the suspension grains in the range above 63 µm (Fig. 12.6). In the
thalweg zone (deep water), there is not much variation in the course of this indicator
between the surface and the bottom zone. Large discrepancies between the average
size of the suspension grains in the range above 63 µm in these zones refer to the