

7 Water Quality in Main Dam Reservoirs in Poland
167
mean 6,49
0.0
1.0
2.0
3.0
4.0
5.0
6.0
7.0
8.0
9.0
17-09-01 0:00
17-09-02 0:00
17-09-03 0:00
17-09-04 0:00
17-09-05 0:00
17-09-06 0:00
17-09-07 0:00
17-09-08 0:00
17-09-09 0:00
17-09-10 0:00
17-09-11 0:00
17-09-12 0:00
17-09-13 0:00
17-09-14 0:00
17-09-15 0:00
17-09-16 0:00
17-09-17 0:00
17-09-18 0:00
17-09-19 0:00
17-09-20 0:00
17-09-21 0:00
17-09-22 0:00
17-09-23 0:00
17-09-24 0:00
17-09-25 0:00
17-09-26 0:00
17-09-27 0:00
17-09-28 0:00
17-09-29 0:00
17-09-30 0:00
17-10-01 0:00
ConcentraƟon (mg/L)
Time
(days hrs)
Dissolved oxygen
mean 6,28
1.0
3.0
5.0
7.0
9.0
11.0
13.0
15.0
17-09-01 0:00
17-09-02 0:00
17-09-03 0:00
17-09-04 0:00
17-09-05 0:00
17-09-06 0:00
17-09-07 0:00
17-09-08 0:00
17-09-09 0:00
17-09-10 0:00
17-09-11 0:00
17-09-12 0:00
17-09-13 0:00
17-09-14 0:00
17-09-15 0:00
17-09-16 0:00
17-09-17 0:00
17-09-18 0:00
17-09-19 0:00
17-09-20 0:00
17-09-21 0:00
17-09-22 0:00
17-09-23 0:00
17-09-24 0:00
17-09-25 0:00
17-09-26 0:00
17-09-27 0:00
17-09-28 0:00
17-09-29 0:00
17-09-30 0:00
17-10-01 0:00
ConcentraƟon (mg/L)
Time
(days hrs)
Nitrates NO 3 -
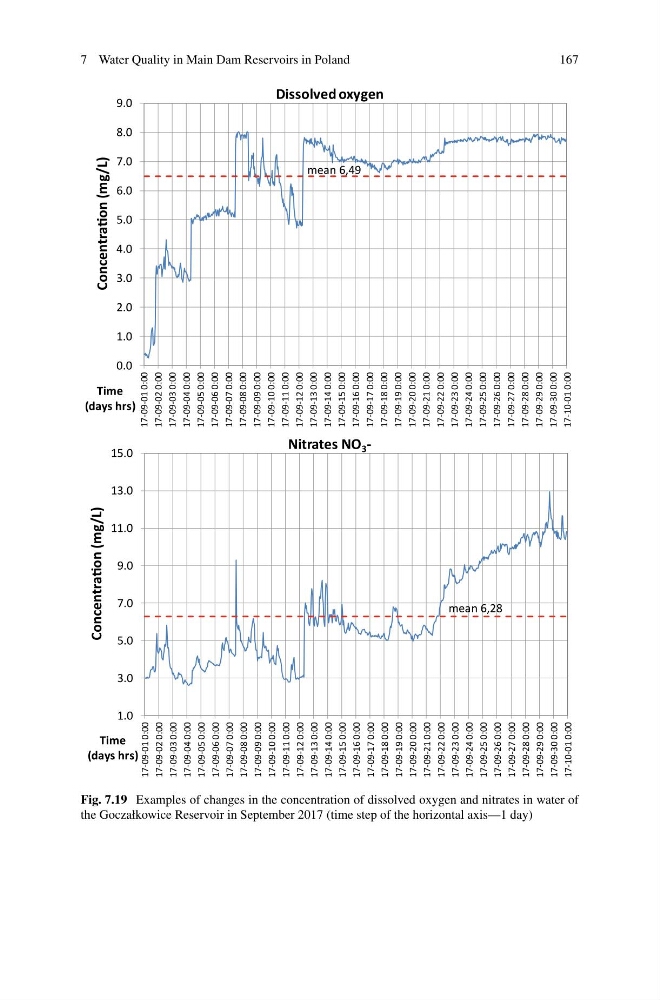
Fig. 7.19 Examples of changes in the concentration of dissolved oxygen and nitrates in water of
the Goczałkowice Reservoir in September 2017 (time step of the horizontal axis—1 day)
167
mean 6,49
0.0
1.0
2.0
3.0
4.0
5.0
6.0
7.0
8.0
9.0
17-09-01 0:00
17-09-02 0:00
17-09-03 0:00
17-09-04 0:00
17-09-05 0:00
17-09-06 0:00
17-09-07 0:00
17-09-08 0:00
17-09-09 0:00
17-09-10 0:00
17-09-11 0:00
17-09-12 0:00
17-09-13 0:00
17-09-14 0:00
17-09-15 0:00
17-09-16 0:00
17-09-17 0:00
17-09-18 0:00
17-09-19 0:00
17-09-20 0:00
17-09-21 0:00
17-09-22 0:00
17-09-23 0:00
17-09-24 0:00
17-09-25 0:00
17-09-26 0:00
17-09-27 0:00
17-09-28 0:00
17-09-29 0:00
17-09-30 0:00
17-10-01 0:00
ConcentraƟon (mg/L)
Time
(days hrs)
Dissolved oxygen
mean 6,28
1.0
3.0
5.0
7.0
9.0
11.0
13.0
15.0
17-09-01 0:00
17-09-02 0:00
17-09-03 0:00
17-09-04 0:00
17-09-05 0:00
17-09-06 0:00
17-09-07 0:00
17-09-08 0:00
17-09-09 0:00
17-09-10 0:00
17-09-11 0:00
17-09-12 0:00
17-09-13 0:00
17-09-14 0:00
17-09-15 0:00
17-09-16 0:00
17-09-17 0:00
17-09-18 0:00
17-09-19 0:00
17-09-20 0:00
17-09-21 0:00
17-09-22 0:00
17-09-23 0:00
17-09-24 0:00
17-09-25 0:00
17-09-26 0:00
17-09-27 0:00
17-09-28 0:00
17-09-29 0:00
17-09-30 0:00
17-10-01 0:00
ConcentraƟon (mg/L)
Time
(days hrs)
Nitrates NO 3 -
Fig. 7.19 Examples of changes in the concentration of dissolved oxygen and nitrates in water of
the Goczałkowice Reservoir in September 2017 (time step of the horizontal axis—1 day)