

132
A. Solarczyk
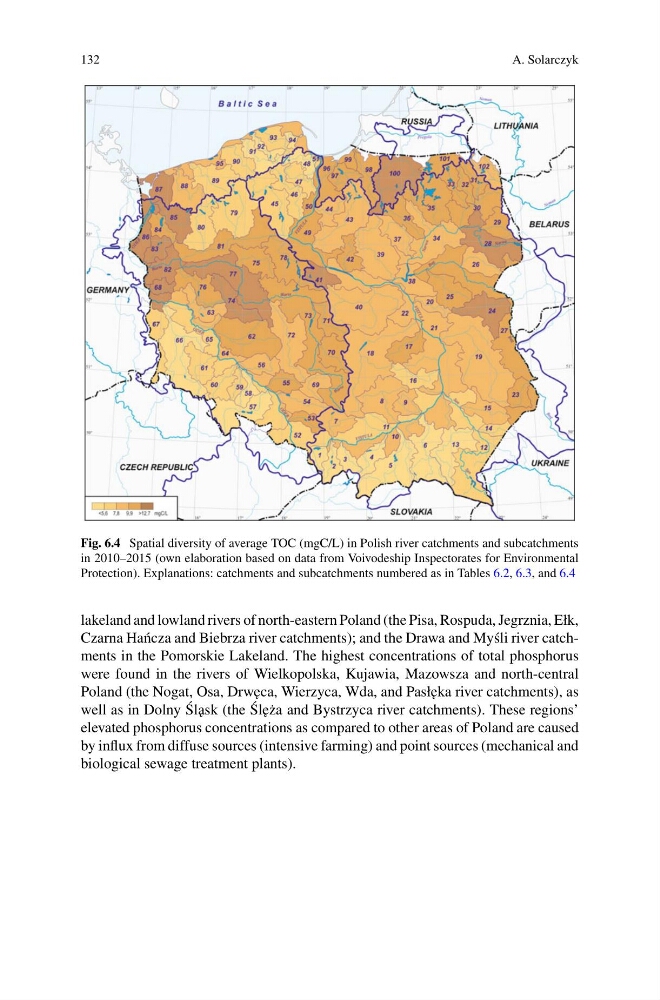
Fig. 6.4 Spatial diversity of average TOC (mgC/L) in Polish river catchments and subcatchments
in 2010–2015 (own elaboration based on data from Voivodeship Inspectorates for Environmental
Protection). Explanations: catchments and subcatchments numbered as in Tables 6.2, 6.3, and 6.4
lakeland and lowland rivers of north-eastern Poland (the Pisa, Rospuda, Jegrznia, Ełk,
Czarna Ha´ ncza and Biebrza river catchments); and the Drawa and My´ sli river catchments in the Pomorskie Lakeland. The highest concentrations of total phosphorus
were found in the rivers of Wielkopolska, Kujawia, Mazowsza and north-central
Poland (the Nogat, Osa, Drw˛ eca, Wierzyca, Wda, and Pasł˛ eka river catchments), as
well as in Dolny ´
Sl˛ ask (the ´
Sl˛ e˙ za and Bystrzyca river catchments). These regions’
elevated phosphorus concentrations as compared to other areas of Poland are caused
by influx from diffuse sources (intensive farming) and point sources (mechanical and
biological sewage treatment plants).
A. Solarczyk
Fig. 6.4 Spatial diversity of average TOC (mgC/L) in Polish river catchments and subcatchments
in 2010–2015 (own elaboration based on data from Voivodeship Inspectorates for Environmental
Protection). Explanations: catchments and subcatchments numbered as in Tables 6.2, 6.3, and 6.4
lakeland and lowland rivers of north-eastern Poland (the Pisa, Rospuda, Jegrznia, Ełk,
Czarna Ha´ ncza and Biebrza river catchments); and the Drawa and My´ sli river catchments in the Pomorskie Lakeland. The highest concentrations of total phosphorus
were found in the rivers of Wielkopolska, Kujawia, Mazowsza and north-central
Poland (the Nogat, Osa, Drw˛ eca, Wierzyca, Wda, and Pasł˛ eka river catchments), as
well as in Dolny ´
Sl˛ ask (the ´
Sl˛ e˙ za and Bystrzyca river catchments). These regions’
elevated phosphorus concentrations as compared to other areas of Poland are caused
by influx from diffuse sources (intensive farming) and point sources (mechanical and
biological sewage treatment plants).