

128
A. Solarczyk
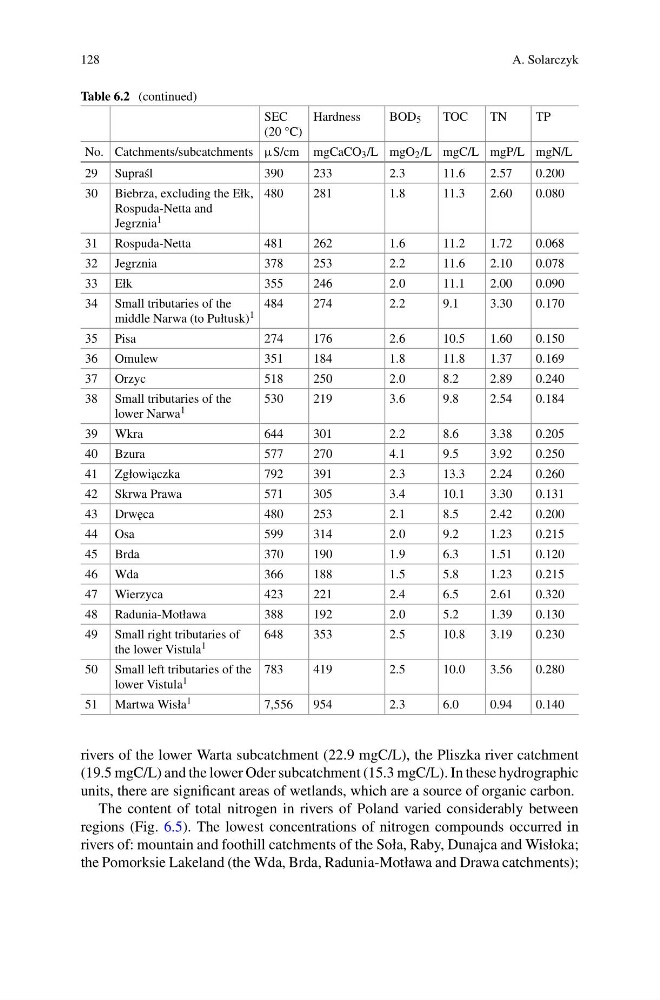
Table 6.2 (continued)
SEC
(20 °C)
Hardness
BOD 5
TOC
TN
TP
No. Catchments/subcatchments µS/cm mgCaCO 3 /L mgO 2 /L mgC/L mgP/L mgN/L
29 Supra´ sl
390
233
2.3
11.6
2.57
0.200
30 Biebrza, excluding the Ełk,
Rospuda-Netta and
Jegrznia 1
480
281
1.8
11.3
2.60
0.080
31 Rospuda-Netta
481
262
1.6
11.2
1.72
0.068
32 Jegrznia
378
253
2.2
11.6
2.10
0.078
33 Ełk
355
246
2.0
11.1
2.00
0.090
34 Small tributaries of the
middle Narwa (to Pułtusk) 1
484
274
2.2
9.1
3.30
0.170
35 Pisa
274
176
2.6
10.5
1.60
0.150
36 Omulew
351
184
1.8
11.8
1.37
0.169
37 Orzyc
518
250
2.0
8.2
2.89
0.240
38 Small tributaries of the
lower Narwa 1
530
219
3.6
9.8
2.54
0.184
39 Wkra
644
301
2.2
8.6
3.38
0.205
40 Bzura
577
270
4.1
9.5
3.92
0.250
41 Zgłowi˛ aczka
792
391
2.3
13.3
2.24
0.260
42 Skrwa Prawa
571
305
3.4
10.1
3.30
0.131
43 Drw˛ eca
480
253
2.1
8.5
2.42
0.200
44 Osa
599
314
2.0
9.2
1.23
0.215
45 Brda
370
190
1.9
6.3
1.51
0.120
46 Wda
366
188
1.5
5.8
1.23
0.215
47 Wierzyca
423
221
2.4
6.5
2.61
0.320
48 Radunia-Motława
388
192
2.0
5.2
1.39
0.130
49 Small right tributaries of
the lower Vistula 1
648
353
2.5
10.8
3.19
0.230
50 Small left tributaries of the
lower Vistula 1
783
419
2.5
10.0
3.56
0.280
51 Martwa Wisła 1
7,556
954
2.3
6.0
0.94
0.140
rivers of the lower Warta subcatchment (22.9 mgC/L), the Pliszka river catchment
(19.5 mgC/L) and the lower Oder subcatchment (15.3 mgC/L). In these hydrographic
units, there are significant areas of wetlands, which are a source of organic carbon.
The content of total nitrogen in rivers of Poland varied considerably between
regions (Fig. 6.5). The lowest concentrations of nitrogen compounds occurred in
rivers of: mountain and foothill catchments of the Soła, Raby, Dunajca and Wisłoka;
the Pomorksie Lakeland (the Wda, Brda, Radunia-Motława and Drawa catchments);
A. Solarczyk
Table 6.2 (continued)
SEC
(20 °C)
Hardness
BOD 5
TOC
TN
TP
No. Catchments/subcatchments µS/cm mgCaCO 3 /L mgO 2 /L mgC/L mgP/L mgN/L
29 Supra´ sl
390
233
2.3
11.6
2.57
0.200
30 Biebrza, excluding the Ełk,
Rospuda-Netta and
Jegrznia 1
480
281
1.8
11.3
2.60
0.080
31 Rospuda-Netta
481
262
1.6
11.2
1.72
0.068
32 Jegrznia
378
253
2.2
11.6
2.10
0.078
33 Ełk
355
246
2.0
11.1
2.00
0.090
34 Small tributaries of the
middle Narwa (to Pułtusk) 1
484
274
2.2
9.1
3.30
0.170
35 Pisa
274
176
2.6
10.5
1.60
0.150
36 Omulew
351
184
1.8
11.8
1.37
0.169
37 Orzyc
518
250
2.0
8.2
2.89
0.240
38 Small tributaries of the
lower Narwa 1
530
219
3.6
9.8
2.54
0.184
39 Wkra
644
301
2.2
8.6
3.38
0.205
40 Bzura
577
270
4.1
9.5
3.92
0.250
41 Zgłowi˛ aczka
792
391
2.3
13.3
2.24
0.260
42 Skrwa Prawa
571
305
3.4
10.1
3.30
0.131
43 Drw˛ eca
480
253
2.1
8.5
2.42
0.200
44 Osa
599
314
2.0
9.2
1.23
0.215
45 Brda
370
190
1.9
6.3
1.51
0.120
46 Wda
366
188
1.5
5.8
1.23
0.215
47 Wierzyca
423
221
2.4
6.5
2.61
0.320
48 Radunia-Motława
388
192
2.0
5.2
1.39
0.130
49 Small right tributaries of
the lower Vistula 1
648
353
2.5
10.8
3.19
0.230
50 Small left tributaries of the
lower Vistula 1
783
419
2.5
10.0
3.56
0.280
51 Martwa Wisła 1
7,556
954
2.3
6.0
0.94
0.140
rivers of the lower Warta subcatchment (22.9 mgC/L), the Pliszka river catchment
(19.5 mgC/L) and the lower Oder subcatchment (15.3 mgC/L). In these hydrographic
units, there are significant areas of wetlands, which are a source of organic carbon.
The content of total nitrogen in rivers of Poland varied considerably between
regions (Fig. 6.5). The lowest concentrations of nitrogen compounds occurred in
rivers of: mountain and foothill catchments of the Soła, Raby, Dunajca and Wisłoka;
the Pomorksie Lakeland (the Wda, Brda, Radunia-Motława and Drawa catchments);