

due to pumping, while the remaining is due to the climate itself (Fig. 8c). This trend
may continue and be reinforced in the future. The overall evolution from the 2000s
to the 2100s may indeed lead to more abundant winter precipitation rates while being
significantly reduced in the summer period (Fig. 8c, d). Although, in the case of the
2100s simulation, no change appears to be significant enough to be notable at the
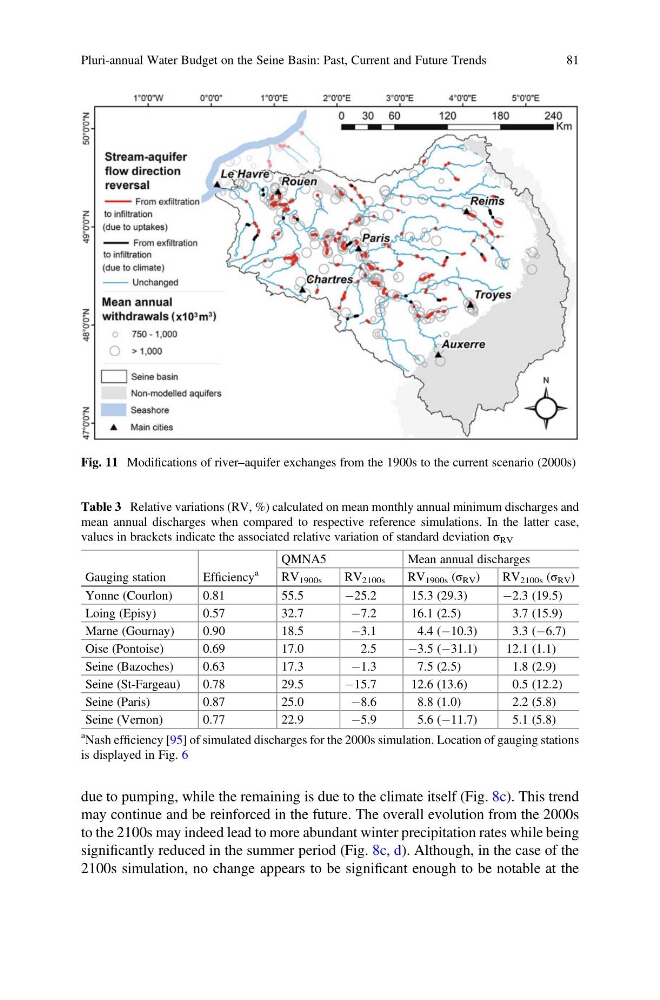
Fig. 11 Modifications of river–aquifer exchanges from the 1900s to the current scenario (2000s)
Table 3 Relative variations (RV, %) calculated on mean monthly annual minimum discharges and
mean annual discharges when compared to respective reference simulations. In the latter case,
values in brackets indicate the associated relative variation of standard deviation σ RV
Gauging station
Efficiency
a
QMNA5
Mean annual discharges
RV 1900s
RV 2100s
RV 1900s (σ RV )
RV 2100s (σ RV )
Yonne (Courlon)
0.81
55.5
À25.2
15.3 (29.3)
À2.3 (19.5)
Loing (Episy)
0.57
32.7
À7.2
16.1 (2.5)
3.7 (15.9)
Marne (Gournay)
0.90
18.5
À3.1
4.4 (À10.3)
3.3 (À6.7)
Oise (Pontoise)
0.69
17.0
2.5
À3.5 (À31.1)
12.1 (1.1)
Seine (Bazoches)
0.63
17.3
À1.3
7.5 (2.5)
1.8 (2.9)
Seine (St-Fargeau)
0.78
29.5
À15.7
12.6 (13.6)
0.5 (12.2)
Seine (Paris)
0.87
25.0
À8.6
8.8 (1.0)
2.2 (5.8)
Seine (Vernon)
0.77
22.9
À5.9
5.6 (À11.7)
5.1 (5.8)
a Nash efficiency [95] of simulated discharges for the 2000s simulation. Location of gauging stations
is displayed in Fig. 6
Pluri-annual Water Budget on the Seine Basin: Past, Current and Future Trends
81
may continue and be reinforced in the future. The overall evolution from the 2000s
to the 2100s may indeed lead to more abundant winter precipitation rates while being
significantly reduced in the summer period (Fig. 8c, d). Although, in the case of the
2100s simulation, no change appears to be significant enough to be notable at the
Fig. 11 Modifications of river–aquifer exchanges from the 1900s to the current scenario (2000s)
Table 3 Relative variations (RV, %) calculated on mean monthly annual minimum discharges and
mean annual discharges when compared to respective reference simulations. In the latter case,
values in brackets indicate the associated relative variation of standard deviation σ RV
Gauging station
Efficiency
a
QMNA5
Mean annual discharges
RV 1900s
RV 2100s
RV 1900s (σ RV )
RV 2100s (σ RV )
Yonne (Courlon)
0.81
55.5
À25.2
15.3 (29.3)
À2.3 (19.5)
Loing (Episy)
0.57
32.7
À7.2
16.1 (2.5)
3.7 (15.9)
Marne (Gournay)
0.90
18.5
À3.1
4.4 (À10.3)
3.3 (À6.7)
Oise (Pontoise)
0.69
17.0
2.5
À3.5 (À31.1)
12.1 (1.1)
Seine (Bazoches)
0.63
17.3
À1.3
7.5 (2.5)
1.8 (2.9)
Seine (St-Fargeau)
0.78
29.5
À15.7
12.6 (13.6)
0.5 (12.2)
Seine (Paris)
0.87
25.0
À8.6
8.8 (1.0)
2.2 (5.8)
Seine (Vernon)
0.77
22.9
À5.9
5.6 (À11.7)
5.1 (5.8)
a Nash efficiency [95] of simulated discharges for the 2000s simulation. Location of gauging stations
is displayed in Fig. 6
Pluri-annual Water Budget on the Seine Basin: Past, Current and Future Trends
81