

1910) (Fig. 2a). Hence, the discharge rates at Pont d’Austerlitz vary within two
orders of magnitude.
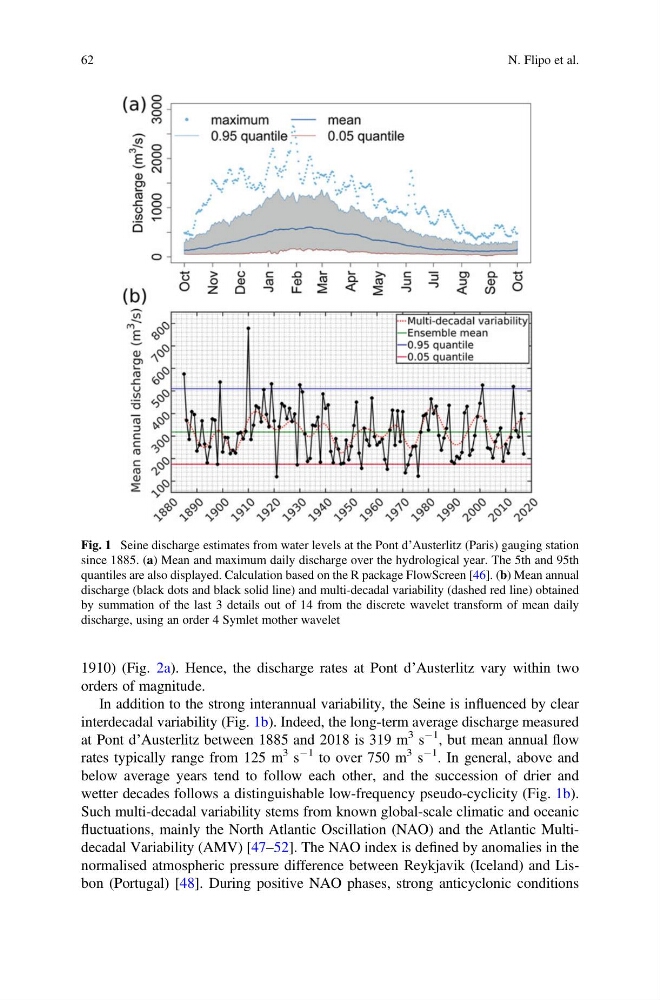
In addition to the strong interannual variability, the Seine is influenced by clear
interdecadal variability (Fig. 1b). Indeed, the long-term average discharge measured
at Pont d’Austerlitz between 1885 and 2018 is 319 m
3 s
À1 , but mean annual flow
rates typically range from 125 m
3 s
À1 to over 750 m
3 s
À1 . In general, above and
below average years tend to follow each other, and the succession of drier and
wetter decades follows a distinguishable low-frequency pseudo-cyclicity (Fig. 1b).
Such multi-decadal variability stems from known global-scale climatic and oceanic
fluctuations, mainly the North Atlantic Oscillation (NAO) and the Atlantic Multidecadal Variability (AMV) [47–52]. The NAO index is defined by anomalies in the
normalised atmospheric pressure difference between Reykjavik (Iceland) and Lisbon (Portugal) [48]. During positive NAO phases, strong anticyclonic conditions
Fig. 1 Seine discharge estimates from water levels at the Pont d’Austerlitz (Paris) gauging station
since 1885. (a) Mean and maximum daily discharge over the hydrological year. The 5th and 95th
quantiles are also displayed. Calculation based on the R package FlowScreen [46]. (b) Mean annual
discharge (black dots and black solid line) and multi-decadal variability (dashed red line) obtained
by summation of the last 3 details out of 14 from the discrete wavelet transform of mean daily
discharge, using an order 4 Symlet mother wavelet
62
N. Flipo et al.
orders of magnitude.
In addition to the strong interannual variability, the Seine is influenced by clear
interdecadal variability (Fig. 1b). Indeed, the long-term average discharge measured
at Pont d’Austerlitz between 1885 and 2018 is 319 m
3 s
À1 , but mean annual flow
rates typically range from 125 m
3 s
À1 to over 750 m
3 s
À1 . In general, above and
below average years tend to follow each other, and the succession of drier and
wetter decades follows a distinguishable low-frequency pseudo-cyclicity (Fig. 1b).
Such multi-decadal variability stems from known global-scale climatic and oceanic
fluctuations, mainly the North Atlantic Oscillation (NAO) and the Atlantic Multidecadal Variability (AMV) [47–52]. The NAO index is defined by anomalies in the
normalised atmospheric pressure difference between Reykjavik (Iceland) and Lisbon (Portugal) [48]. During positive NAO phases, strong anticyclonic conditions
Fig. 1 Seine discharge estimates from water levels at the Pont d’Austerlitz (Paris) gauging station
since 1885. (a) Mean and maximum daily discharge over the hydrological year. The 5th and 95th
quantiles are also displayed. Calculation based on the R package FlowScreen [46]. (b) Mean annual
discharge (black dots and black solid line) and multi-decadal variability (dashed red line) obtained
by summation of the last 3 details out of 14 from the discrete wavelet transform of mean daily
discharge, using an order 4 Symlet mother wavelet
62
N. Flipo et al.