

Box 1 (continued)
Distance covered since the furnace began operating
Slag input
Blast furnace
Pile of blast
furnace slag
Reservoir and weir
Weir disturbing sediment transport
Slag size sort ing
Downstream limit
reached by the slag
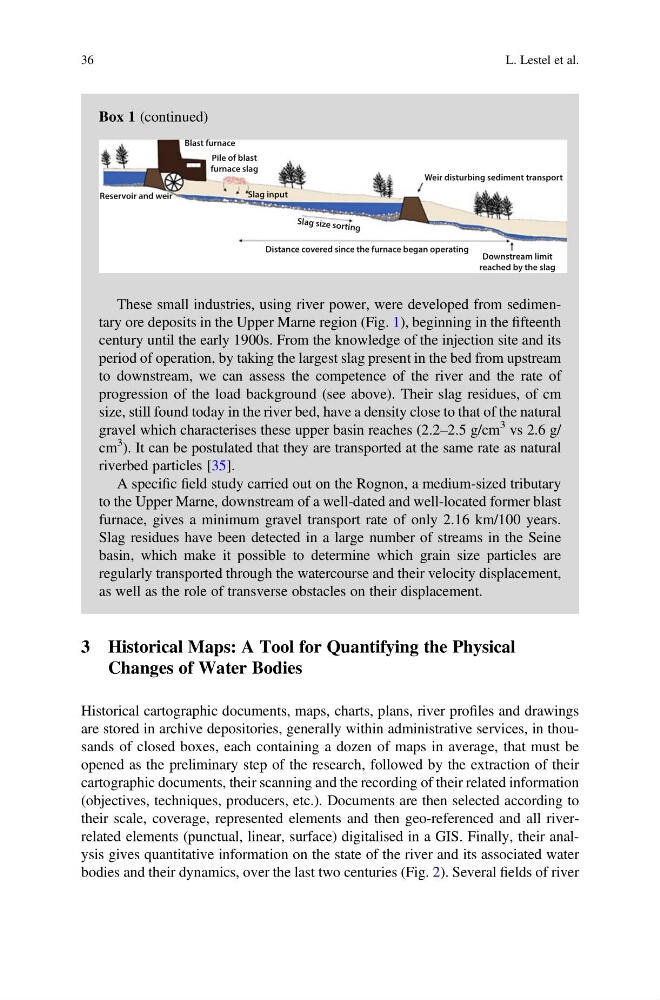
These small industries, using river power, were developed from sedimentary ore deposits in the Upper Marne region (Fig. 1), beginning in the fifteenth
century until the early 1900s. From the knowledge of the injection site and its
period of operation, by taking the largest slag present in the bed from upstream
to downstream, we can assess the competence of the river and the rate of
progression of the load background (see above). Their slag residues, of cm
size, still found today in the river bed, have a density close to that of the natural
gravel which characterises these upper basin reaches (2.2–2.5 g/cm
3 vs 2.6 g/
cm
3 ). It can be postulated that they are transported at the same rate as natural
riverbed particles [35].
A specific field study carried out on the Rognon, a medium-sized tributary
to the Upper Marne, downstream of a well-dated and well-located former blast
furnace, gives a minimum gravel transport rate of only 2.16 km/100 years.
Slag residues have been detected in a large number of streams in the Seine
basin, which make it possible to determine which grain size particles are
regularly transported through the watercourse and their velocity displacement,
as well as the role of transverse obstacles on their displacement.
3 Historical Maps: A Tool for Quantifying the Physical
Changes of Water Bodies
Historical cartographic documents, maps, charts, plans, river profiles and drawings
are stored in archive depositories, generally within administrative services, in thousands of closed boxes, each containing a dozen of maps in average, that must be
opened as the preliminary step of the research, followed by the extraction of their
cartographic documents, their scanning and the recording of their related information
(objectives, techniques, producers, etc.). Documents are then selected according to
their scale, coverage, represented elements and then geo-referenced and all riverrelated elements (punctual, linear, surface) digitalised in a GIS. Finally, their analysis gives quantitative information on the state of the river and its associated water
bodies and their dynamics, over the last two centuries (Fig. 2). Several fields of river
36
L. Lestel et al.
Distance covered since the furnace began operating
Slag input
Blast furnace
Pile of blast
furnace slag
Reservoir and weir
Weir disturbing sediment transport
Slag size sort ing
Downstream limit
reached by the slag
These small industries, using river power, were developed from sedimentary ore deposits in the Upper Marne region (Fig. 1), beginning in the fifteenth
century until the early 1900s. From the knowledge of the injection site and its
period of operation, by taking the largest slag present in the bed from upstream
to downstream, we can assess the competence of the river and the rate of
progression of the load background (see above). Their slag residues, of cm
size, still found today in the river bed, have a density close to that of the natural
gravel which characterises these upper basin reaches (2.2–2.5 g/cm
3 vs 2.6 g/
cm
3 ). It can be postulated that they are transported at the same rate as natural
riverbed particles [35].
A specific field study carried out on the Rognon, a medium-sized tributary
to the Upper Marne, downstream of a well-dated and well-located former blast
furnace, gives a minimum gravel transport rate of only 2.16 km/100 years.
Slag residues have been detected in a large number of streams in the Seine
basin, which make it possible to determine which grain size particles are
regularly transported through the watercourse and their velocity displacement,
as well as the role of transverse obstacles on their displacement.
3 Historical Maps: A Tool for Quantifying the Physical
Changes of Water Bodies
Historical cartographic documents, maps, charts, plans, river profiles and drawings
are stored in archive depositories, generally within administrative services, in thousands of closed boxes, each containing a dozen of maps in average, that must be
opened as the preliminary step of the research, followed by the extraction of their
cartographic documents, their scanning and the recording of their related information
(objectives, techniques, producers, etc.). Documents are then selected according to
their scale, coverage, represented elements and then geo-referenced and all riverrelated elements (punctual, linear, surface) digitalised in a GIS. Finally, their analysis gives quantitative information on the state of the river and its associated water
bodies and their dynamics, over the last two centuries (Fig. 2). Several fields of river
36
L. Lestel et al.